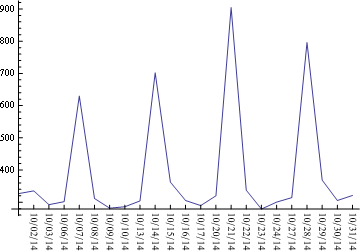
ListLinePlot[d1[[All, 2]], PlotRange -> All,
Ticks -> {Transpose[{Range@Length@d1,
Rotate[#, -Pi/ 2] & /@ (DateString[#, {"Month", "/", "Day", "/",
"YearShort"}] & /@ d1[[All, 1]])}], Automatic}]
