5
$\begingroup$

I have this data:

data =
  {{{2015, 3, 25}, 130}, {{2015, 3, 26}, 132}, {{2015, 3, 27}, 
    132}, {{2015, 3, 30}, 133}, {{2015, 3, 31}, 132}, {{2015, 4, 1}, 
    131}, {{2015, 4, 2}, 131}, {{2015, 4, 3}, 131}, {{2015, 4, 6}, 
    131}, {{2015, 4, 7}, 131}, {{2015, 4, 8}, 129}, {{2015, 4, 9}, 
    132}, {{2015, 4, 10}, 133}, {{2015, 4, 13}, 132}, {{2015, 4, 14}, 
    131}, {{2015, 4, 15}, 131}, {{2015, 4, 16}, 128}, {{2015, 4, 17}, 
    125}, {{2015, 4, 20}, 127}, {{2015, 4, 21}, 127}};

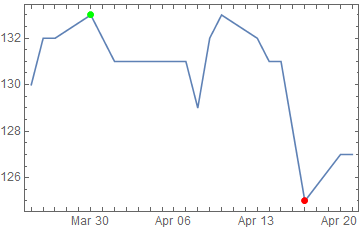
I want to produce with DateListPlot an image almost like this one:
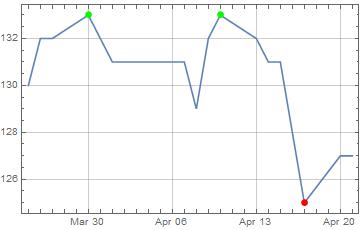
enter image description here

Almost? If there are more than one maxima or minima only the first point should be plotted.

In reality my data is much longer.

What could an elegant and efficient answer look like?

$\endgroup$
0

4 Answers 4

8
$\begingroup$

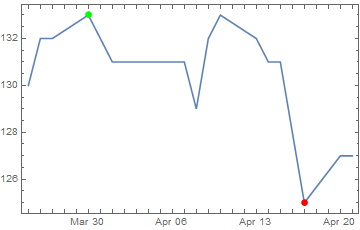
Perhaps a bit more elegant than Sjoerd's approach:

data = Sort @ data;   (* address Sjoerd's concern *)

pts = {
   data,
   MinimalBy[data, Last, 1],
   MaximalBy[data, Last, 1]
 };

DateListPlot[pts,
  Joined    -> {True, False, False}, 
  PlotStyle -> {Automatic, Red, Green}
]

enter image description here

$\endgroup$
5
  • $\begingroup$ Certainly a highly fashionable answer :) $\endgroup$
    – eldo
    Apr 22, 2015 at 16:21
  • $\begingroup$ Does this guarantee that you always pick the first peak if there are ties and data isn't ordered? $\endgroup$ Apr 22, 2015 at 22:18
  • $\begingroup$ @Sjoerd The data appeared to be ordered. Sort it if it is not. $\endgroup$
    – Mr.Wizard
    Apr 22, 2015 at 22:36
  • $\begingroup$ That's what I did already. The data given is just an example. Just wanted to point out that you have an implicit and unwarranted assumption in your approach. $\endgroup$ Apr 22, 2015 at 22:45
  • $\begingroup$ @Sjoerd I added a sort to my code. $\endgroup$
    – Mr.Wizard
    Apr 22, 2015 at 23:06
4
$\begingroup$

Haven't aimed for efficiency or elegance but for 'straightforwardness'

data = Sort@data; (* just to make sure the dates are always sorted *)

max = Max@data[[All, 2]];
min = Min@data[[All, 2]];
maxPos = FirstPosition[data[[All, 2]], max] // First;
minPos = FirstPosition[data[[All, 2]], min] // First;

maxPlotPos = MapAt[AbsoluteTime, data[[maxPos]], 1];
minPlotPos = MapAt[AbsoluteTime, data[[minPos]], 1];

DateListPlot[data, 
 Epilog -> {Green, PointSize[.02], Point@maxPlotPos, Red, Point@minPlotPos}]

Mathematica graphics

$\endgroup$
4
$\begingroup$

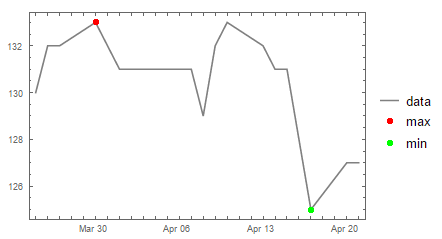
Lest we forget the old-fashined ways:

extremes=data[[Ordering[# data[[All,2]],1][[1]]&/@{-1,1}]];

DateListPlot[{data,##&@@(List/@extremes)},
 Joined -> {True,False,False}, BaseStyle -> PointSize[Large],
 PlotStyle -> {Gray,Red, Green}, PlotLegends -> {"data", "max","min"}]

enter image description here

Note: If data is not sorted, we need to sort it first (*thanks: @Sjoerd *):

data = data[[Ordering[data]]];
extremes = data[[Ordering[# data[[All, 2]], 1][[1]] & /@ {-1, 1}]];
$\endgroup$
5
  • $\begingroup$ I have always liked your styles: ##&@@ is extremely nice :) $\endgroup$
    – eldo
    Apr 22, 2015 at 19:04
  • 1
    $\begingroup$ Thank you @eldo. I think i learned it from Mr.W. $\endgroup$
    – kglr
    Apr 22, 2015 at 20:04
  • $\begingroup$ Does this guarantee that you always pick the first peak if there are ties and data isn't ordered? $\endgroup$ Apr 22, 2015 at 22:17
  • $\begingroup$ Yes, I am fairly sure I am the one who infected you. :o) $\endgroup$
    – Mr.Wizard
    Apr 22, 2015 at 22:37
  • $\begingroup$ @SjoerdC.deVries, good point; it doesn't. So, that gives us another chance to use Ordering:) $\endgroup$
    – kglr
    Apr 22, 2015 at 22:52
3
$\begingroup$

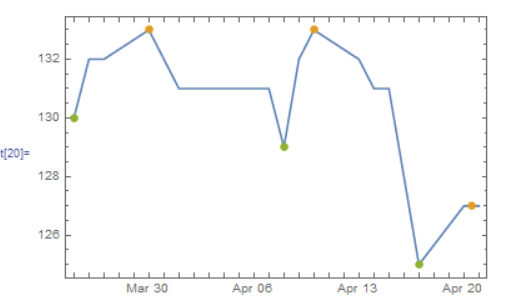
Do you care about maxima and minima or peaks? If peaks then you could use FindPeaks but this is only available for M10+. Note also that FindPeaks only handles regularly spaced TimeSeries - hence the use of TemporalRegularity:

data = TimeSeries[{{{2015, 3, 25}, 130}, {{2015, 3, 26}, 
 132}, {{2015, 3, 27}, 132}, {{2015, 3, 30}, 133}, {{2015, 3, 31},
  132}, {{2015, 4, 1}, 131}, {{2015, 4, 2}, 131}, {{2015, 4, 3}, 
 131}, {{2015, 4, 6}, 131}, {{2015, 4, 7}, 131}, {{2015, 4, 8}, 
 129}, {{2015, 4, 9}, 132}, {{2015, 4, 10}, 133}, {{2015, 4, 13}, 
 132}, {{2015, 4, 14}, 131}, {{2015, 4, 15}, 131}, {{2015, 4, 16},
  128}, {{2015, 4, 17}, 125}, {{2015, 4, 20}, 
 127}, {{2015, 4, 21}, 127}}, TemporalRegularity -> True];
DateListPlot[{data, FindPeaks[data], 
TimeSeriesMap[#*-1 &, FindPeaks[TimeSeriesMap[#*-1 &, data]]]}, 
Joined -> {True, False, False}]

enter image description here

$\endgroup$
4
  • $\begingroup$ I think this is expressly not what eldo requested but since you just introduced me to TemporalRegularity here is my +1. $\endgroup$
    – Mr.Wizard
    Apr 22, 2015 at 17:00
  • $\begingroup$ Right, I was not looking for peaks.+1 for the reason given by wiz. I will play with TemporalRegularity tomorrow :) $\endgroup$
    – eldo
    Apr 22, 2015 at 17:26
  • $\begingroup$ @eldo I did push the Almost? in your question a bit far, but I decided to try and break 1000 before midnight and needed all the awkwardly placed fruit I could find. Strange to see TemporalRegularity is only mentioned three times on MMA.SE, glad to have given you something to play with though. $\endgroup$ Apr 22, 2015 at 19:57
  • 1
    $\begingroup$ Well, you hit it !!! $\endgroup$
    – eldo
    Apr 22, 2015 at 20:24

Your Answer

By clicking “Post Your Answer”, you agree to our terms of service and acknowledge you have read our privacy policy.

Not the answer you're looking for? Browse other questions tagged or ask your own question.