10
$\begingroup$

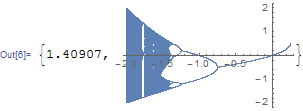
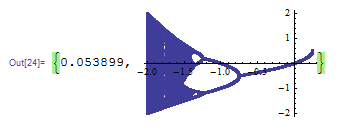
I compared the time it took to create a plot in two different ways. I expected the first method to be slower, but I was surprised at how much. Is this an inherent limitation or the function, or are there options I could use to speed up the plotting in cases where I need to actually use coordinate pairs? compare
z[0, c_] := c;
z[n_, c_] := z[n - 1, c]^2 + c;
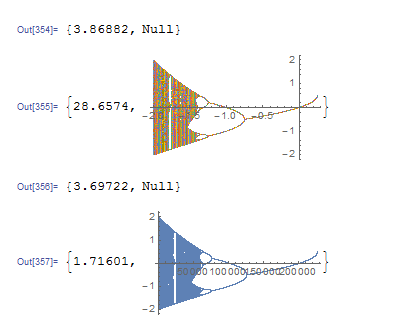
Timing[a = Table[{x, #} & /@ NestList[#^2 + x &, z[999, x], 100], {x, -2, .25, .001}];]
Timing[ListPlot[a]]
Timing[b = Flatten[Table[NestList[#^2 + x &, z[999, x], 100], {x, -2, .25, .001}]];]
Timing[ListPlot[b]]

The first method creates {x,y} pairs, while the second just creates y's. The plots look the same because the x's happen to be evenly spaced and in order, and because the horizontal offset between points that correspond to the same x is too small to see.

$\endgroup$
1
  • 1
    $\begingroup$ I don't have access to older versions, but apparently one way to speed it up would be to use version 7 $\endgroup$
    – Jason B.
    Commented Feb 18, 2016 at 11:37

2 Answers 2

14
$\begingroup$

That's not entirely true:

a // Dimensions

{2251, 101, 2}

So it's a 2d array of paris, and each row is treated as separate set to plot, ListPlot is trying to style them differently, etc. That's what takes time probably.

You can keep pairs and do a fast plot reducing it to simple list of pairs. With Flatten[#,1] or Catenate:

ListPlot[
  a
  ] // AbsoluteTiming

enter image description here

ListPlot[
  Catenate @ a
  ] // AbsoluteTiming

enter image description here

$\endgroup$
1
  • $\begingroup$ Great answer. I miss the pretty colors but enjoy the 20x speed up. $\endgroup$ Commented Feb 18, 2016 at 10:08
7
$\begingroup$

Kuba has already given a good answer, I just want to mention, if generating speed is concerned:

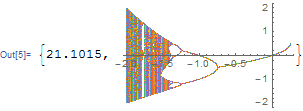
Graphics[{ColorData[1, "ColorList"][[1]], Point@Flatten[a, 1]}, Axes -> True, 
  AspectRatio -> 1/GoldenRatio] // AbsoluteTiming

enter image description here

But sadly the displaying speed of the above result seems to be slower than that of ListPlot. See the comments below for more information.

$\endgroup$
7
  • 1
    $\begingroup$ It seems that ListPlot is optimized for displaying and Graphics for generating. I tried with Graphics too but a problem is that AbsoluteTiming is unreliable. Try setting t = AbsoluteTime[]; before that code and print AbsoluteTime[]-t after. It's about 50% longer than ListPlot solution, and not even close to what AbsoluteTiming says. On the other hand, if you just want to generate it and save, Graphics is better. $\endgroup$
    – Kuba
    Commented Feb 18, 2016 at 9:04
  • 2
    $\begingroup$ I believe part of the overhead is due to the fact that ListPlot[] is trying to do a lot of "smart" things behind the scenes (e.g. the plot theme), so if one is fine with a plain display, using Graphics[] with primitives is very attractive. $\endgroup$ Commented Feb 18, 2016 at 9:07
  • $\begingroup$ @Kuba Yeah, I noticed it just now, too. Quite surprising I should say, I thought ListPlot is just a Graphics generator! $\endgroup$
    – xzczd
    Commented Feb 18, 2016 at 9:18
  • 1
    $\begingroup$ When I ask a question and it touches off a discussion among experts that's completely over my head, I feel a brief and probably undeserved sense of accomplishment. $\endgroup$ Commented Feb 19, 2016 at 1:01
  • 1
    $\begingroup$ I think it just needs a Developer`ToPackedArray[Flatten[a,1]] to make it render as fast as ListPlot (have not really measured that...), so it might be that use of packed arrays is all the "hidden" optimization that ListPlot does... $\endgroup$ Commented Feb 19, 2016 at 10:20

Your Answer

By clicking “Post Your Answer”, you agree to our terms of service and acknowledge you have read our privacy policy.

Not the answer you're looking for? Browse other questions tagged or ask your own question.