2
$\begingroup$

I decided to make my own SmoothHistogram3D function because I wanted to be able to specify my own bin sizes and not rely on their distribution functions so taking a cue from this answer and bringing it into the 3rd dimension I created this function:

Create3DHist[histData_] := Module[{xAxis, yAxis, intensity, yAndI, xYAndI},
    xAxis = histData[[1, 1]];
    yAxis = histData[[1, 2]];
    binCounts = histData[[2]];
    (* Sorry it gets a little messy here *)
    yAndI = Map[{yAxis[[1 ;; -2]], #}\[Transpose] &, binCounts];
    xYAndI = Partition[Flatten[MapThread[Thread[{##}] &, {xAxis[[1 ;; -2]], yAndI}]], 3];
    ListPlot3D[xYAndI, InterpolationOrder -> 3, PlotRange -> All]
]

(I got the idea for the xYAndI line from this answer)

which takes the result of 2d HistogramList data and creates a 3D plot with it, like this:

data = RandomVariate[BinormalDistribution[.5], 1000];
histBinnedData = HistogramList[data, {{0.2}, {0.2}}];
Create3DHist[histBinnedData]

This produces a plot that looks like this:
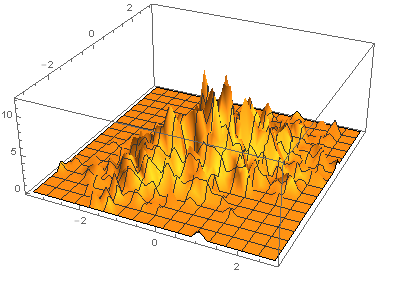
enter image description here

However, I found I could create a much more appealing plot if I just use the binCounts and put the plot range on top of it (which is essentially the same as using BinCounts instead of the HistogramList).

 ListPlot3D[histBinnedData[[2]], InterpolationOrder -> 3, PlotRange -> All, DataRange -> {{-3, 3}, {-3, 3}}]

which produces:
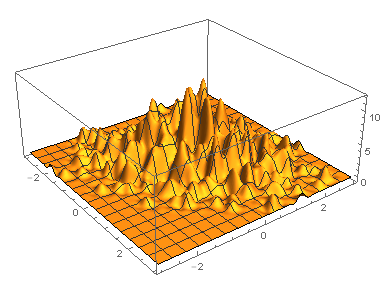
enter image description here

which is a lot smoother. However, my issue is that my smoothing algorithm uses non-equal bin sizes, so using DataRange to place the numbers onto the axes is imperfect because the binCounts aren't evenly spaced, but are treated as such by DataRange. However, my create3DHist function doesn't have that issue. So after all that my question is, is there a way to combine the smoothness of the 2nd method with the x and y axis accuracy of the first method? Also, what causes this difference in smoothing even though they both use an interpolation order of 3?

Small Update:

I realized the reason why the second method comes out so much smoother is because mathematica uses a lot more points than just the array you give it to plot it for the second method. I used mesh->All to compare how many points each plot had and got this result:
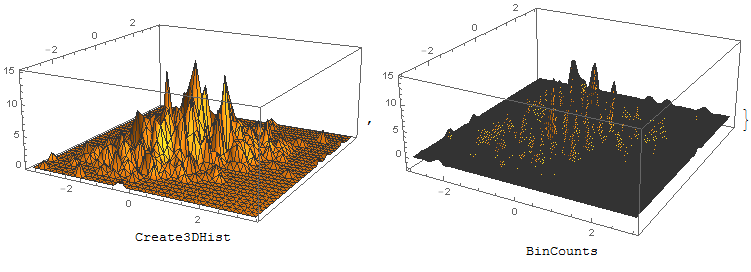
Comparison of the amount of actual points in each plot using the mesh option

Is there anyway to extract the points in the second way and fix masses to them, or is there a way to fill in points in the first method so that it is more like the second method?

$\endgroup$
1
  • $\begingroup$ It seems to me that InterpolationOrder doesn't work properly on unstructured grids. $\endgroup$
    – ybeltukov
    Commented Sep 19, 2014 at 23:05

1 Answer 1

3
$\begingroup$

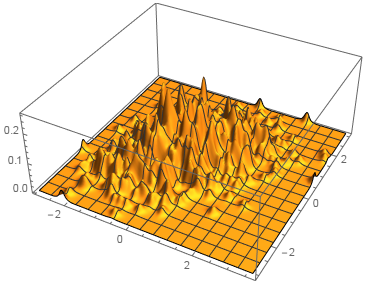
You can apply post-processing to the regular ListPlot3D

data = RandomVariate[BinormalDistribution[.5], 1000];
{{x, y}, hist} = HistogramList[data, {{0.1}, {0.1}}, "PDF"];

{fx, fy} = Interpolation@Transpose@{Range[0.5, Length@#], #} & /@ {x, y};

ListPlot3D[GaussianFilter[Transpose@hist, {3, 1}], InterpolationOrder -> 3,
   PlotRange -> All] /. GraphicsComplex[p_, d_, opts___] :> 
  GraphicsComplex[Transpose@{fx@#, fy@#2, #3} & @@ Transpose@p, d, 
   Sequence @@ ({opts} /. (VertexNormals -> n_) :> (VertexNormals -> 
           n/Transpose@{fx'@#, fy'@#2, 1 + 0 #3} & @@ Transpose@p))]

enter image description here

P.S. Without GaussianFilter or another sort of smoothing it is just an interpolated histogram, not a smoothed histogram.

$\endgroup$
6
  • $\begingroup$ Thanks. This is a good solution and a lot simpler than the path I was thinking of taking. Do you know why the shading seems to disappears though? $\endgroup$
    – Jon F.
    Commented Sep 19, 2014 at 23:26
  • $\begingroup$ haha I plan to use this to create plots that I smooth by altering the bin sizes, but as I was writing the question I confused myself and started calling all the histograms smooth histograms just because they looked smooth. Thanks for the clarification. $\endgroup$
    – Jon F.
    Commented Sep 19, 2014 at 23:34
  • 1
    $\begingroup$ @HorseWith I forget to update vertex normals. See my update. $\endgroup$
    – ybeltukov
    Commented Sep 19, 2014 at 23:46
  • $\begingroup$ This solution has been very helpful so far, but I've noticed that when a ColorFunction option is added to ListPlot3D the axes numbers shift and start at the origin instead of their actual x and y values. Do you know if there's a way around this? $\endgroup$
    – Jon F.
    Commented Sep 22, 2014 at 14:40
  • 1
    $\begingroup$ @HorseWith It was because I wrote too simple pattern. I update it to accept additional options. Does it work now? $\endgroup$
    – ybeltukov
    Commented Sep 22, 2014 at 14:57

Your Answer

By clicking “Post Your Answer”, you agree to our terms of service and acknowledge you have read our privacy policy.

Not the answer you're looking for? Browse other questions tagged or ask your own question.