1
$\begingroup$

I want to do a DFT of a fragment of music,and then plot the magnitude with dB instead of amplitude. For example:

music = ExampleData[{"Sound", "Violin"}];
data = music[[1, 1, 1]];
data = data[[22050*2 ;; 22050*2 + 1024 - 1]];(*length of data:1024*)
maxofdata = data // Abs // Max;
data = data/maxofdata;(*normalize the data*)

ListLinePlot[data, AspectRatio -> 1/8, PlotStyle -> Thick]

enter image description here

xdb = Fourier[data, FourierParameters -> {1, -1}][[;; 512]] // (20 Log10[Abs@#]) &;
xdbMax = Max@xdb;
xdbn = xdb - xdbMax;
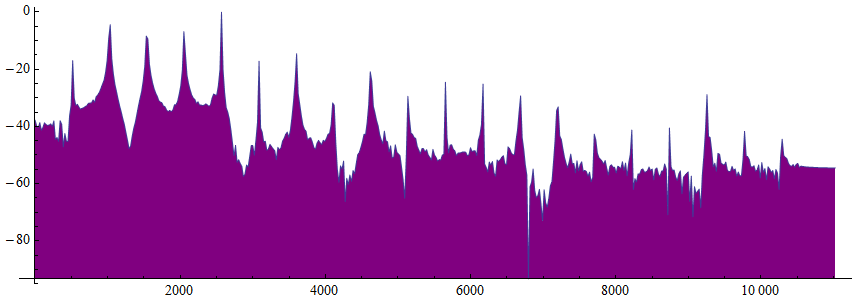
xdbn // ListLinePlot[#, Filling -> Axis, FillingStyle -> Purple, DataRange -> {0, 22050/2}, AspectRatio -> 1/3] &

enter image description here

But If I export the fragment of music into Audacity,and then get this plot. enter image description here You can see the two plot are similar,but a little different on vertical axis. So how to correct my code to get the same result?
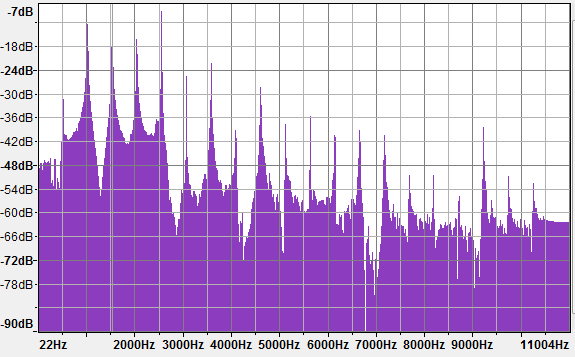
And when doing the DFT,I use the Rectangular window. However in order to make the spectrum more smooth,I want to use other window function,How to do it?

$\endgroup$
5
  • 3
    $\begingroup$ It's hard to say, without knowing how Audacity defines the 0dB level. If you can find that out, then I have no doubt that you'll be able to reproduce the result in Mathematica. IMO, without that being specified, your result makes more sense than the one given by Audacity. $\endgroup$ Commented Jan 22, 2016 at 13:12
  • 1
    $\begingroup$ Every definition I find of the decibel talks about the ratio of the intensity to a reference intensity. Hyperphysics says they commonly use the 'threshold of hearing' as the reference value. But you take the reference to be the loudest part of the data. Therefore by default your data will max out at 0. $\endgroup$
    – Jason B.
    Commented Jan 22, 2016 at 13:17
  • $\begingroup$ Duplicate of 80655 ? $\endgroup$
    – N.J.Evans
    Commented Jan 22, 2016 at 14:35
  • 1
    $\begingroup$ @N.J.Evans your answer to the other question is a good one, but I'd say it's not really a duplicate. Unlike in the other question, this user clearly knows the definition of a decibel to start with and has managed to correctly plot in dB. The only question is what is the reference level, and to be honest I think this query can probably only be answered by the people who wrote Audacity. I'm tempted to vote to close as unanswerable in this forum. $\endgroup$ Commented Jan 26, 2016 at 14:20
  • 2
    $\begingroup$ Actually, according to this page about how Audacity works, "the ratio is of amplitude relative to zero dBFS" (FS means full scale). So the reference level is not the maximum of the data but the maximum possible sample value. $\endgroup$ Commented Jan 26, 2016 at 14:24

2 Answers 2

0
$\begingroup$

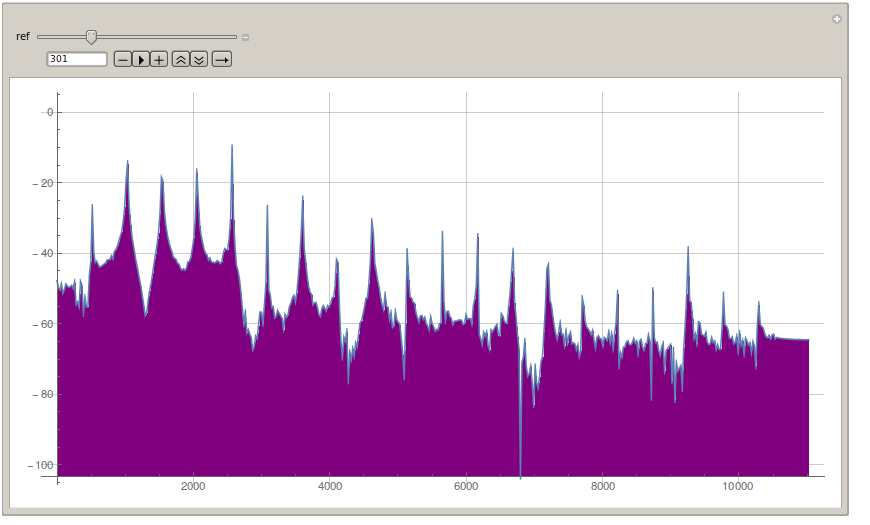
Without knowing what the units for the sound intensity in Mathematica are, it's hard to input the standard threshold of hearing value of $10^{-16} watts/cm^2$. You can use `Manipulate to adjust the reference value so that your plot matches the one you got from Audacity,

music = ExampleData[{"Sound", "Violin"}];
data = music[[1, 1, 1]];
data = data[[22050*2 ;; 22050*2 + 1024 - 1]];
maxofdata = data // Abs // Max;
ft = Abs@Fourier[data, FourierParameters -> {1, -1}][[;; 512]];
Manipulate[
 xdb = ft // (20 Log10[Abs@#/ref]) &;

 xdbMax = Max@xdb;
 xdb // ListLinePlot[#, AxesOrigin -> {0, Min@xdb},
    Filling -> Axis,
    FillingStyle -> Purple,
    DataRange -> {0, 22050/2},
    AspectRatio -> 1/2,
    GridLines -> Automatic,
    ImageSize -> 800] &, {{ref, 100}, 50, 1000, 1}]

enter image description here

$\endgroup$
0
$\begingroup$

You could use the follow code, where an arbitrary reference of 80 db is used.

xdb = Fourier[data, 
 FourierParameters -> {1, -1}][[;; 512]] // (20 Log10[Abs@#]) &;
 xdbMax = Max@xdb;
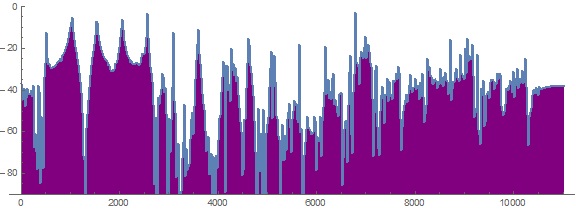
 xdbn = 20 Log[Norm /@ xdb] - 80;
 xdbn // ListLinePlot[#, Filling -> -90, FillingStyle -> Purple, 
 DataRange -> {0, 22050/2}, AspectRatio -> 1/3, 
 PlotRange -> {All, {-90, 0}}, ImageSize -> Large, 
 AxesOrigin -> {0, -90}] &

enter image description here

$\endgroup$

Your Answer

By clicking “Post Your Answer”, you agree to our terms of service and acknowledge you have read our privacy policy.

Not the answer you're looking for? Browse other questions tagged or ask your own question.