5
$\begingroup$

Now I'm trying to solve a PDE and the solving domain is not regular, suppose it is a map. I used the finite element method to solve it and every nodes' value have been got, and now I want to use ListPlot3D to plot them,but the ListPlot3D doesn't work well: the plot region is over the desired region, I used RegionFunction to specify it, but it doesn't work. How can I plot the proper region?

First I creat the mesh by using the function MeshRegion,

mesh = MeshRegion[trinode, Polygon@trielement];

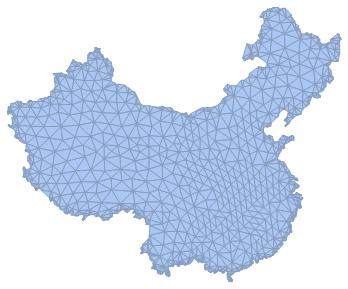
The mesh is like this

enter image description here

and then I got every nodes' value by using the FEM and stored them in the variable triplotpoint in this way:

triplotpoint={{x1,y1,z1},{x2,y2,z2}...}

where the $x_n$ and $y_n$ are the coordinate of the nth node and the $z_n$ is the node's value.

Then I use the function ListPlot3D to plot them

plots = ListPlot3D[triplotpoint,PlotRange -> All,ColorFunction -> "Rainbow",RegionFunction -> Function[{x, y, z}, {x, y}\[Element] mesh]]

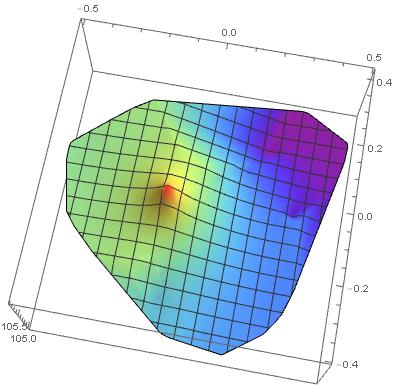
but I didn't get the result I want.

enter image description here

How can the figure shows only in the mesh region?

$\endgroup$
1
  • $\begingroup$ Welcome to Mathematica.SE! I suggest the following: 1) As you receive help, try to give it too, by answering questions in your area of expertise. 2) Take the tour! 3) When you see good questions and answers, vote them up by clicking the gray triangles, because the credibility of the system is based on the reputation gained by users sharing their knowledge. Also, please remember to accept the answer, if any, that solves your problem, by clicking the checkmark sign! $\endgroup$
    – Michael E2
    Commented Nov 8, 2015 at 15:10

1 Answer 1

7
$\begingroup$

Here's one way. Note NDSolve would have returned an ElementMeshInterpolation, so some of these steps should be unnecessary in your use-case.

Needs["NDSolve`FEM`"];

cp = CountryData["China", "Polygon"];

mesh = DiscretizeGraphics@RegionPlot@cp; 
emesh = ToElementMesh@mesh;

cm = RegionCentroid[mesh];
values = EuclideanDistance[cm, #] & /@ emesh["Coordinates"];

ifn = ElementMeshInterpolation[{emesh}, values]

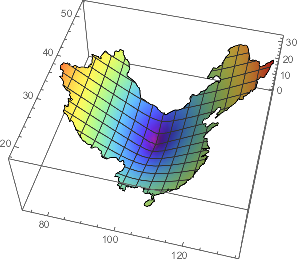
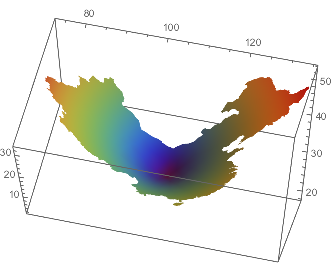
Plot3D[ifn[x, y], {x, y} ∈ emesh, ColorFunction -> "Rainbow"]

Mathematica graphics

NDSolve example:

ifn2 = NDSolveValue[
  {Laplacian[u[x, y], {x, y}] == 0,
   DirichletCondition[u[x, y] == EuclideanDistance[cm, {x, y}], True]},
  u, {x, y} ∈ emesh]

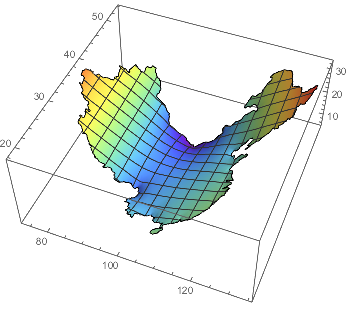
Plot3D[ifn2[x, y], {x, y} ∈ ifn2["ElementMesh"], ColorFunction -> "Rainbow"]

Mathematica graphics

Another way:

triplotpoints = Partition[Flatten@Transpose[{emesh["Coordinates"], values}], 3];

normals = Transpose[{
    -Derivative[1, 0][ifn] @@@ emesh["Coordinates"],
    -Derivative[0, 1][ifn] @@@ emesh["Coordinates"],
    ConstantArray[1., Length@emesh["Coordinates"]]
    }];

Graphics3D[
 GraphicsComplex[triplotpoints,
  {EdgeForm[],
   emesh["MeshElements"] /. TriangleElement[p_] :> Polygon[p[[All, 1 ;; 3]]]},
  VertexColors -> (ColorData["Rainbow"] /@ Rescale[triplotpoints[[All, 3]]]),
  VertexNormals -> normals
  ],
 Axes -> True]

Mathematica graphics

The normals may be omitted for speed, if you do not care about the smooth rendering.

(Still not ListPlot3D. :( Note that ListPlot@InterpolatingFunction[..] works nicely for a 1D InterpolatingFunction, but the same functionality does not seem to exist for 2D functions.)

$\endgroup$
1
  • $\begingroup$ Thanks for your detailed answer :) $\endgroup$
    – Ice0cean
    Commented Nov 13, 2015 at 2:54

Your Answer

By clicking “Post Your Answer”, you agree to our terms of service and acknowledge you have read our privacy policy.

Not the answer you're looking for? Browse other questions tagged or ask your own question.