One very general way to solve this kind of problem is to use GeodesicDilation to find the peaks.
The intuition behind GeodesicDilation is that you dilate an image, then "clip" it using a mask image, i.e. for every pixel in the mask and the dilated image, you choose the darker of the two pixels. So the mask limits the growth of the dilation. This is repeated until convergence.
To find peaks, you start with "reduced" version of the source image, i.e. you subtract a constant from the image or multiply it by a constant, then dilate it using the original image as mask. In 1d, the result looks like this:
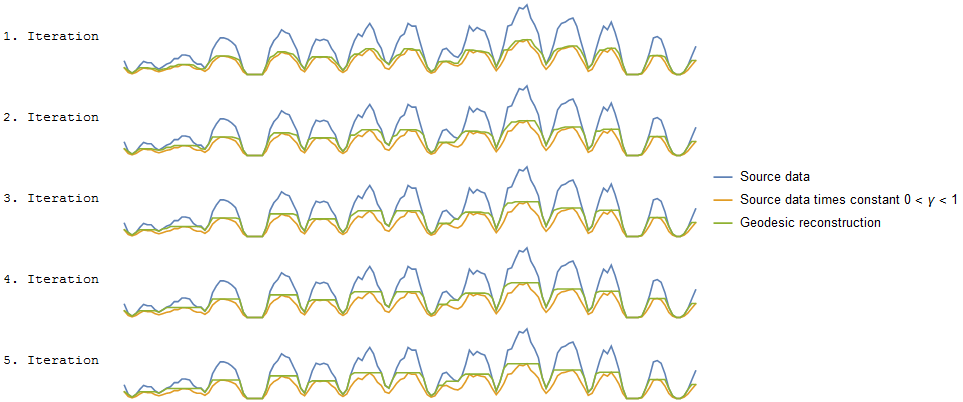
As you can see, the reconstruction (the green line) grows in every iteration, until it reaches the "borders" of the source image. Now, if you subtract this reconstruction from the source image:

...everything but the peaks will be zero.
In 2d:
img = ColorConvert[Import["https://i.sstatic.net/4gWnl.png"], "Grayscale"];
γ = 0.5;
plateu = GeodesicDilation[ImageMultiply[img, γ], img];
bin = Binarize[ImageDifference[plateu, img], 0];
bin = Erosion[bin, 1]
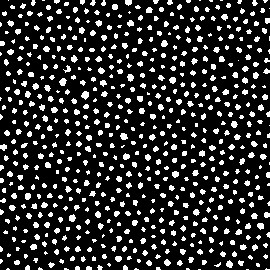
I've used Erosion to remove small 1-pixel peaks and to separate close peaks, but you might want to play with different alternatives (e.g. the watershed-based algorithm @Pickett linked to - now that you have a marker image, that should work fine.)
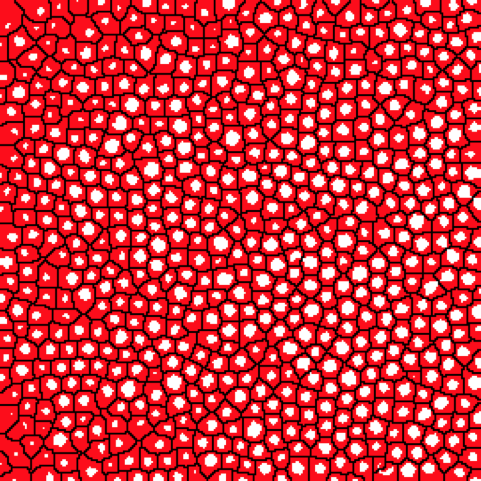
Final step: Find centroids and draw the Voronoi cells:
centroids = ComponentMeasurements[bin, "Centroid"][[All, 2]];
v = VoronoiMesh[centroids];
Show[img,
 Graphics[{Red,
   GraphicsComplex[MeshCoordinates[v], MeshCells[v, 1]]}]]
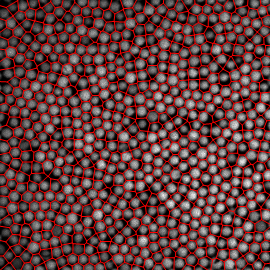

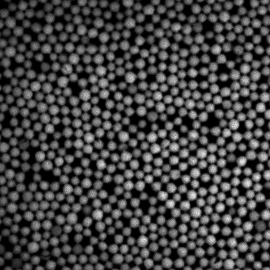


WatershedComponentstend to partition the background into multiple components probably because this image is packed. And still I can't find a proper threshold forBinarizeto break up the spheres without losing some darker ones on the left. $\endgroup$WatershedComponentsdoesn't work. This should be enough to generate the Voronoi diagram, is this enough for you? $\endgroup$Binarizeto break apart the joining spheres without losing some darker ones on the left. $\endgroup$ImageCorrelate[image, GaussianMatrix[3]] // MaxDetect // ComponentMeasurements[#, "Centroid"][[All, 2]] & // VoronoiMesh // HighlightMesh[#, {Style[1, Red], Style[2, Opacity[0]]}] & // Show[image, #] &. The sequence of operations, reading left to right along the processing pipeline, is smooth to reduce noise, detect peaks, find centroids of peaks, convert to Voronoi mesh, highlight the mesh itself but make its cells invisible, overlay the mesh on the original image. $\endgroup$