5
$\begingroup$

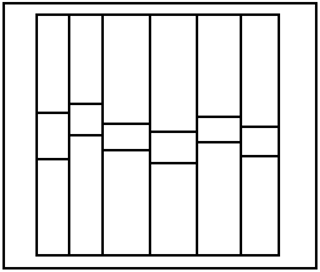
I have image files (PNG format) of plane maps of regions delimited by black borders

enter image description here

I would like Mathematica to compute the associated adjacency matrix for the contiguous regions in these maps.

So far I can find the regions using the command MorphologicalComponents, which associates an integer $1, 2, \ldots $ to the set of pixels corresponding to each region

How can I go on to compute the adjacency matrix?

Thanks.

$\endgroup$

1 Answer 1

10
$\begingroup$
<< Combinatorica`;
i = Binarize@Import["https://i.sstatic.net/gFZ3F.png"];
mc = MorphologicalComponents[i];
l = Flatten[Thread /@ ComponentMeasurements[MaxFilter[mc, 3], "Neighbors"] /. 
            Rule -> List, 1];
am = ToAdjacencyMatrix@FromOrderedPairs[l];
f[n_] := f[n] = Rasterize@ ImageAdd[
    Image[Unitize[mc - n] /. {1 -> {0, 0, 0}, 0 -> RandomReal[{0, 1}, 3]}, 
          ImageSize -> IntegerPart@(ImageDimensions@i/10)], 
    ColorNegate@i]
k[i_, j_] := k[i, j] = k[j, i] = ImageAdd[f[i], f[j]]
mi = MapIndexed[Tooltip[#1 /. 
            {0 -> Graphics[{FaceForm[White], EdgeForm[Black], Rectangle[]}], 
             1 -> Graphics[{Orange, Rectangle[]}]}, k @@ #2] &, am, {2}];
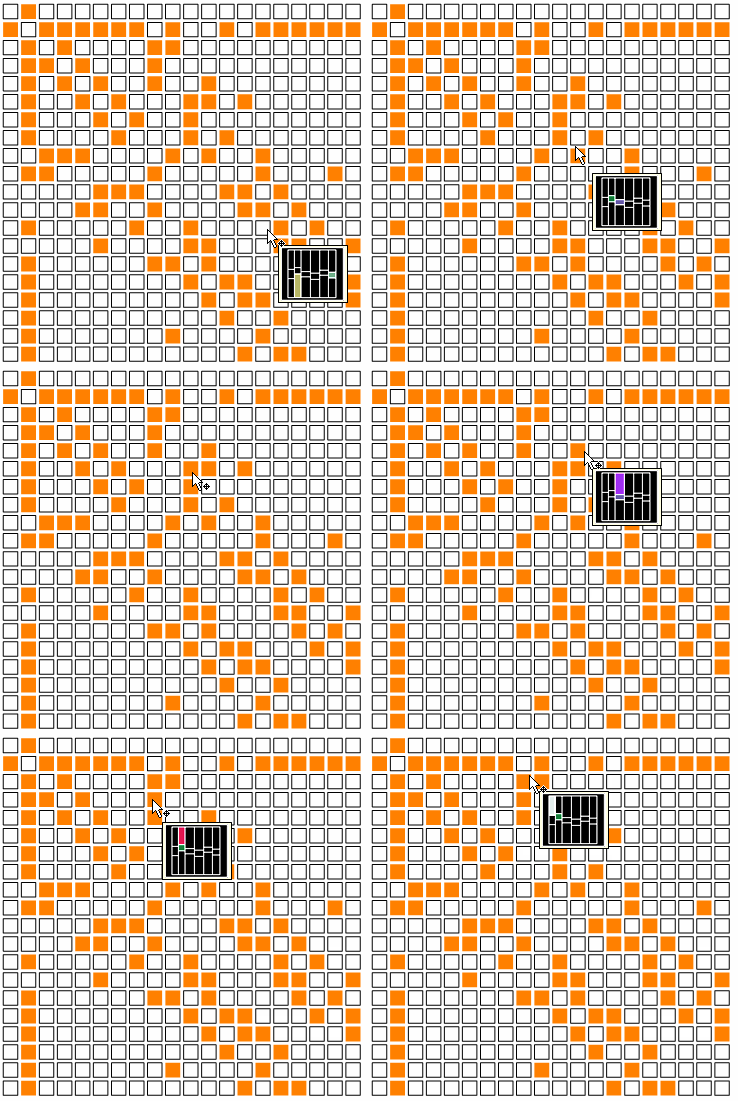
GraphicsGrid@mi
enter image description here

Or the simpler:

<< Combinatorica`;
i = Binarize@Import["https://i.sstatic.net/gFZ3F.png"];
mc = MorphologicalComponents[i];
l = Flatten[ Thread /@ ComponentMeasurements[MaxFilter[mc, 3], "Neighbors"] /.
                                                                    Rule -> List, 1];
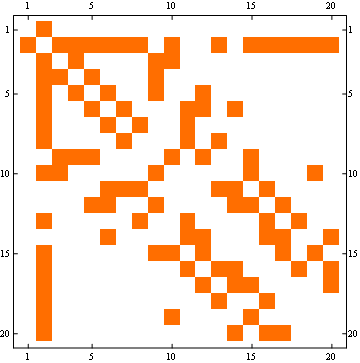
ToAdjacencyMatrix@FromOrderedPairs[l] // MatrixPlot
Mathematica graphics

$\endgroup$
9
  • 1
    $\begingroup$ Very nice! Just wanted to add that equivalent functionality can be obtained in versions newer than 8 without loading Combinatorica by using AdjacencyMatrix@Graph[l]. (+1) $\endgroup$
    – MarcoB
    Commented Sep 7, 2015 at 4:05
  • $\begingroup$ Thanks a lot, but this code isn't working as I'm expecting. For example, using the test image i.imgur.com/iwMCSeI.png I calculate by hand the adjacency matrix to be: $$\left( \begin{array}{ccccccc} 0 & 1 & 1 & 0 & 1 & 0 & 1 \\ 1 & 0 & 0 & 1 & 0 & 0 & 0 \\ 1 & 0 & 0 & 1 & 0 & 0 & 0 \\ 0 & 1 & 1 & 0 & 1 & 0 & 0 \\ 1 & 0 & 0 & 1 & 0 & 1 & 0 \\ 0 & 0 & 0 & 0 & 1 & 0 & 1 \\ 1 & 0 & 0 & 0 & 0 & 1 & 0 \\ \end{array} \right)$$ $\endgroup$
    – nasosev
    Commented Sep 7, 2015 at 5:12
  • $\begingroup$ but your code gives: $$\left( \begin{array}{ccccccc} 0 & 1 & 1 & 1 & 1 & 1 & 1 \\ 1 & 0 & 0 & 1 & 1 & 0 & 0 \\ 1 & 0 & 0 & 1 & 1 & 0 & 0 \\ 1 & 1 & 1 & 0 & 1 & 0 & 0 \\ 1 & 1 & 1 & 1 & 0 & 1 & 0 \\ 1 & 0 & 0 & 0 & 1 & 0 & 1 \\ 1 & 0 & 0 & 0 & 0 & 1 & 0 \\ \end{array} \right)$$ $\endgroup$
    – nasosev
    Commented Sep 7, 2015 at 5:14
  • 1
    $\begingroup$ @AthanasiosEvangelou It's difficult to fit any configuration. You may try something like i1 = Binarize@Import["http://i.imgur.com/iwMCSeI.png"]; i = ColorNegate@Thinning@ColorNegate@i1; mc = MorphologicalComponents[MaxFilter[ImageData[i1], 1] // Image]; l = Flatten[ Thread /@ ComponentMeasurements[MaxFilter[mc, 1], "Neighbors"] /. Rule -> List, 1]; (am = ToAdjacencyMatrix@FromOrderedPairs[l]) // MatrixPlot $\endgroup$ Commented Sep 7, 2015 at 6:02
  • 3
    $\begingroup$ @AthanasiosEvangelou Questions here normally work the other way. You first work hard to define your problem, then perhaps you find someone to help you. Please define "neighbor", "black border" and state your max and min image, region and line sizes $\endgroup$ Commented Sep 7, 2015 at 13:03

Your Answer

By clicking “Post Your Answer”, you agree to our terms of service and acknowledge you have read our privacy policy.

Not the answer you're looking for? Browse other questions tagged or ask your own question.