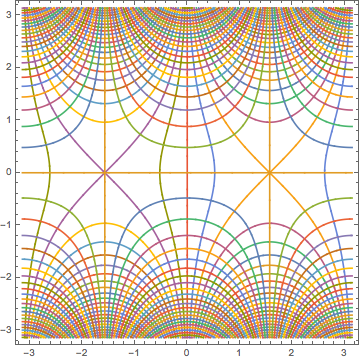
I updated to Mathematica 10 from Mathematica 9. I am trying to create contour plots. I have a saved file with some output that I made using Mathematica 9, with the following equation
ContourPlot[ Evaluate @ {Table[Re @ Sin[x + I y] == 1/2 k, {k, -25, 25}],
                     Table[Im @ Sin[x + I y] == 1/2 k, {k, -25, 25}]},
         {x, -Pi, Pi}, {y, -Pi, Pi}, PlotPoints -> 100, MaxRecursion -> 5]
and it worked for me then. This code also worked for Artes, in his answer here.
Now under Mathematica 10 I get a blank graph. I've tried playing around with the equation but am unable to reproduce anything. Does anybody know what the problem might be?

