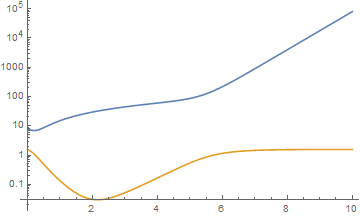
These are the equations for Poincaré sections:
    M = 0.5; a = 0.2; s = 0.1;M = 1/2; Δ = r^2 - 2*M*r[t] + a^2;
    W = r[t]^2 + a^2*Cos[θ[t]]^2;
    h = s*M^3*r[t]/W^2;
    gtt = -Simplify[(1 - 2*M*r[t]/W)*(1 + h)];
    grr = Simplify[W (1 + h)/(Δ + a^2*Sin[θ[t]]^2*h)];
    gss = W;
    gff = Simplify[(r[t]^2 + a^2 + 2 a^2*M*r[t]*Sin[θ[t]]^2/W)*
    Sin[θ[t]]^2 + h*a^2*Sin[θ[t]]^4*(1 + 2*M*r[t]/W)]
    gtf = -2*a*M*r[t]*Sin[θ[t]]^2*(1 + h)/W
    L = 1/2 (gtt*en^2 + grr*D[r[t], t]^2 + gss*D[θ[t], t]^2 +
    gff*ln^2 + 2 gtf*en*ln);
I would like to plot the Poincaré section for collection of (r[t], Derivative[1][r][t]), I wrote:
   date = Block[{en = 0.95, ln = 1.5},
   Reap[NDSolve[{grr*(r^′′)[t] ==
   D[L, r[t]] - D[grr, r[t]]*Derivative[1][r][t]^2 -
    D[grr, θ[t]]*Derivative[1][r][t]*
     Derivative[1][θ][t],
  gss*(θ^′′)[t] ==
   D[L, θ[t]] -
    D[gss, θ[t]]*Derivative[1][θ][t]^2 -
    D[gss, r[t]]*Derivative[1][r][t]*Derivative[1][θ][t],
  r[0] == 8, θ[0] == Pi/2,
  WhenEvent[Derivative[1][r][0] == 0,
   Sow[{r[t], Derivative[1][r][t]}]]}, {}, {t, 100000},
 MaxSteps -> ∞]]][[-1, 1]]; ListPlot[data,
ImageSize -> Medium, PlotRange -> {{0, 20}, All},
 PlotStyle -> PointSize[0.0025]]
But it does not work.

