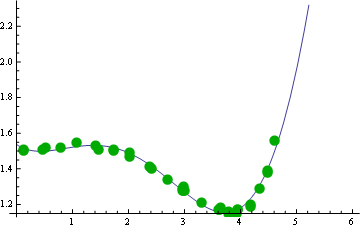
I am almost new in Mathematica, and so I have some problems that may appear basic for you. I am given a set of data taken from an experiment. I am supposed to find the curve that best fits them. The data are:
data = {{0.12, 1.51}, {0.12, 1.50}, {0.46, 1.51}, {0.51, 1.52}, {0.79,
     1.52}, {1.07, 1.55}, {1.41, 1.53}, {1.46, 1.51}, {1.73,
    1.51}, {1.74, 1.50}, {2.02, 1.49}, {2.02, 1.47}, {2.37,
    1.41}, {2.42, 1.40}, {2.70, 1.34}, {2.97, 1.28}, {2.97,
    1.29}, {2.98, 1.28}, {2.99, 1.30}, {3.00, 1.28}, {3.31,
    1.21}, {3.61, 1.17}, {3.62, 1.17}, {3.65, 1.18}, {3.78,
    1.15}, {3.79, 1.16}, {3.93, 1.15}, {3.94, 1.17}, {3.94,
    1.17}, {4.18, 1.19}, {4.18, 1.20}, {4.34, 1.29}, {4.48,
    1.39}, {4.48, 1.38}, {4.60, 1.56}};
Originally, I was looking for a function of the form
$$a - bx - \frac{c - (dx - e)^2}{f - (g x - k)^3}$$
where $a,b,c,d,e,f,g,k$ are constants to be determined, but if you have better ideas for the function form, please inform me. The code I used is:
nlm = NonlinearModelFit[
  data, (a - bx - (c - (dx - e)^2)/(f - (g x - k)^3)), {a, b, c, d, e,
    f, g, k}, x]
Show[Plot[nlm[x], {x , 0, 6}]
 , ListPlot[data, PlotStyle -> {Darker@Green, PointSize[0.03]}]]
But I get a number of errors, like "First argument data in NonlinearModelFit is not a list or a rectangular arrow" I am searching for such a function desperately for some time now, I would deeply appreciate any help I could get....


bxis a symbol,b xorb*xis b times x, fix that (with dx ) and you're on your way... $\endgroup$d xversusdx. $\endgroup$