1
$\begingroup$

Good Morning, I have a set of experimental data which i want to fit with a formula that I know it works. I tried to write a code in mathematica notebook that I put it here

data = {{1.45045*10^8, 1.}, {7.44768*10^8, 0.8787}, {1.81148*10^9,0.7013}, {3.34183*10^9, 0.5414}, {5.33711*10^9,0.3959}, {7.80159*10^9, 0.2703}, {1.07275*10^10,0.1857}, {1.41183*10^10, 0.1399}, {1.79806*10^10,0.1022}, {2.2302*10^10, 0.07084}, {2.70884*10^10,0.04772}, {3.23398*10^10,0.03562}, {3.80655*10^10,0.02567}, {4.42474*10^10, 0.01419}, {5.08944*10^10,0.01431}, {5.80178*10^10, 0.01108}};
model = 1/(1 + σ^2/DD*b)^(DD/σ)^2;
nml = NonlinearModelFit[data, model, {DD, σ}, b]

Show[
  Plot[nlm[b], {b, 0, 10^11}],
  ListPlot[data, PlotStyle -> {Darker@Green, PointSize[0.03]}]
]

It gives some errors. I want to show the superposition of original data and the fitting function on semiLog (in the ordinate axis). Can you help me Please? Thank you. Have a nice day.

$\endgroup$
6
  • $\begingroup$ It's because it's trying out negative values. Add constraints so it doesn't try to explore negative values for DD and σ and it works: nml = NonlinearModelFit[data, {model, σ > 0, DD > 0}, {DD, σ}, b]. You can get the parameters with nml["ParameterTable"]. Also watch out, you are plotting nlm[b] not nml[b] - must be a typo? $\endgroup$
    – flinty
    Commented Sep 11, 2020 at 16:34
  • 2
    $\begingroup$ The fit itself is terrible though. Maybe you should consider a better model. $\endgroup$
    – flinty
    Commented Sep 11, 2020 at 16:40
  • $\begingroup$ Your problem is the wildly different scalings of the two variables. Try data[[All, 1]] = data[[All, 1]]/10^10 and you'll get a near perfect fit with no need for constraints. $\endgroup$
    – JimB
    Commented Sep 11, 2020 at 17:03
  • $\begingroup$ Alternatively, if you use model = 1/(1 + \[Sigma]^2/DD*(b/10^10))^(DD/\[Sigma])^2;, then the fit will also work with no problems. $\endgroup$
    – JimB
    Commented Sep 11, 2020 at 21:11
  • $\begingroup$ @flinty How did you judge the fit of the model to be terrible? Once one accounts for the scaling of the predictor variable, then it looks fine. $\endgroup$
    – JimB
    Commented Sep 11, 2020 at 21:13

2 Answers 2

3
$\begingroup$

Changing the model definition from

model = 1/(1 + σ^2/DD*b)^(DD/σ)^2;

to

model = 1/(1 + σ^2/DD*(b/10^10))^(DD/σ)^2;

will fix the problem.

data = {{1.45045*10^8, 1.}, {7.44768*10^8, 0.8787}, {1.81148*10^9, 0.7013},
  {3.34183*10^9, 0.5414}, {5.33711*10^9, 0.3959}, {7.80159*10^9, 0.2703},
  {1.07275*10^10, 0.1857}, {1.41183*10^10, 0.1399}, {1.79806*10^10, 0.1022}, 
  {2.2302*10^10, 0.07084}, {2.70884*10^10, 0.04772}, {3.23398*10^10, 0.03562},
  {3.80655*10^10, 0.02567}, {4.42474*10^10, 0.01419}, {5.08944*10^10, 0.01431},
  {5.80178*10^10, 0.01108}};
model = 1/(1 + σ^2/DD*(b/10^10))^(DD/σ)^2;
nlm = NonlinearModelFit[data, model, {DD, σ}, b];
nlm["BestFitParameters"]
(* {DD -> 2.05829, σ -> 1.22768} *)
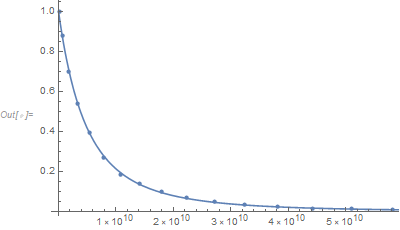
Show[ListPlot[data], Plot[nlm[x], {x, 0, 6 10^10}, PlotRange -> All]]

Data and fit

$\endgroup$
1
$\begingroup$

Consider not using a pre-conceived model:

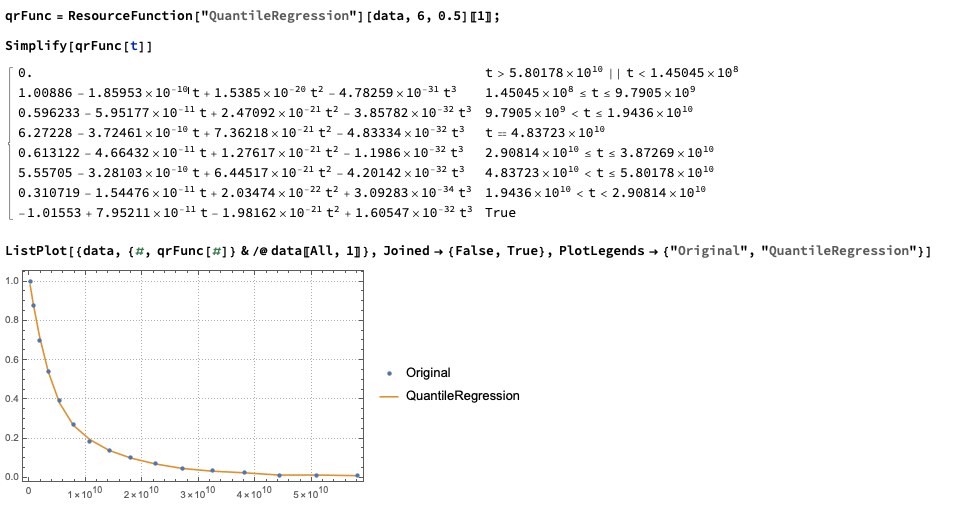
Quantile Regression

qrFunc = ResourceFunction["QuantileRegression"][data, 6, 0.5][[1]];

Simplify[qrFunc[t]]

ListPlot[{data, {#, qrFunc[#]} & /@ data[[All, 1]]}, 
 Joined -> {False, True}, 
 PlotLegends -> {"Original", "QuantileRegression"}]

enter image description here

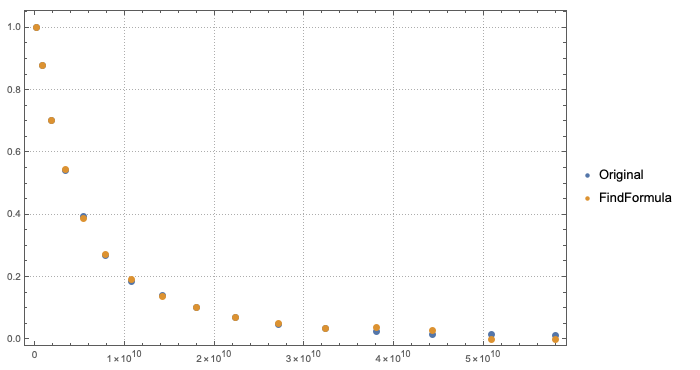
FindFormula

ffFunc = FindFormula[data];

(* ffFunc = Piecewise[{{1.3784372096038422 - 
       0.018976070116910493*Log[#1] - 1.504938184291008*^-10*#1, 
      Inequality[1.45045*^8, LessEqual, #1, Less, 
              2.664504676051075*^9]}, {9.462060930568198 - 
       0.4091705591204782*Log[#1] + 1.6776712526675216*^-11*#1, 
            
      Inequality[2.664504676051075*^9, LessEqual, #1, Less, 
       2.177107509602669*^10]}, {2.3369081717676714 - 
       0.09516385999471486*Log[#1], 
            
      Inequality[2.177107509602669*^10, LessEqual, #1, Less, 
       3.5441247654932556*^10]}, {1.5828759881621233 - 
       0.0634289715131976*Log[#1], 
            
      Inequality[3.5441247654932556*^10, LessEqual, #1, Less, 
       4.756828177139195*^10]}}, 0] & ; *)

ListPlot[{data, {#, ffFunc[#]} & /@ data[[All, 1]]}, 
 PlotLegends -> {"Original", "FindFormula"}]

enter image description here

$\endgroup$
2
  • $\begingroup$ Thank you for your answer. However, if I try to fit a different set of data (from the same experiment but at different temperature) it does not work. $\endgroup$
    – Michaels
    Commented Sep 11, 2020 at 19:00
  • $\begingroup$ @Michaels FindFormula is a little bit of "wild card" -- try it at least a few times with the same data, you should get different fit functions. Also, I used FindFormula to illustrate my point. In general, I would use Quantile Regression. $\endgroup$ Commented Sep 11, 2020 at 20:01

Your Answer

By clicking “Post Your Answer”, you agree to our terms of service and acknowledge you have read our privacy policy.

Not the answer you're looking for? Browse other questions tagged or ask your own question.