6
$\begingroup$

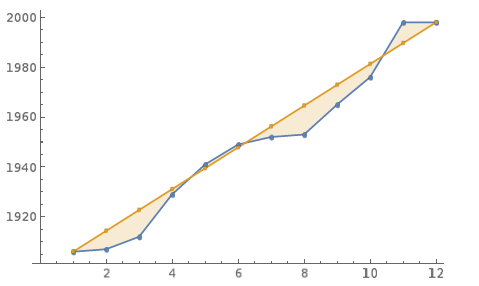
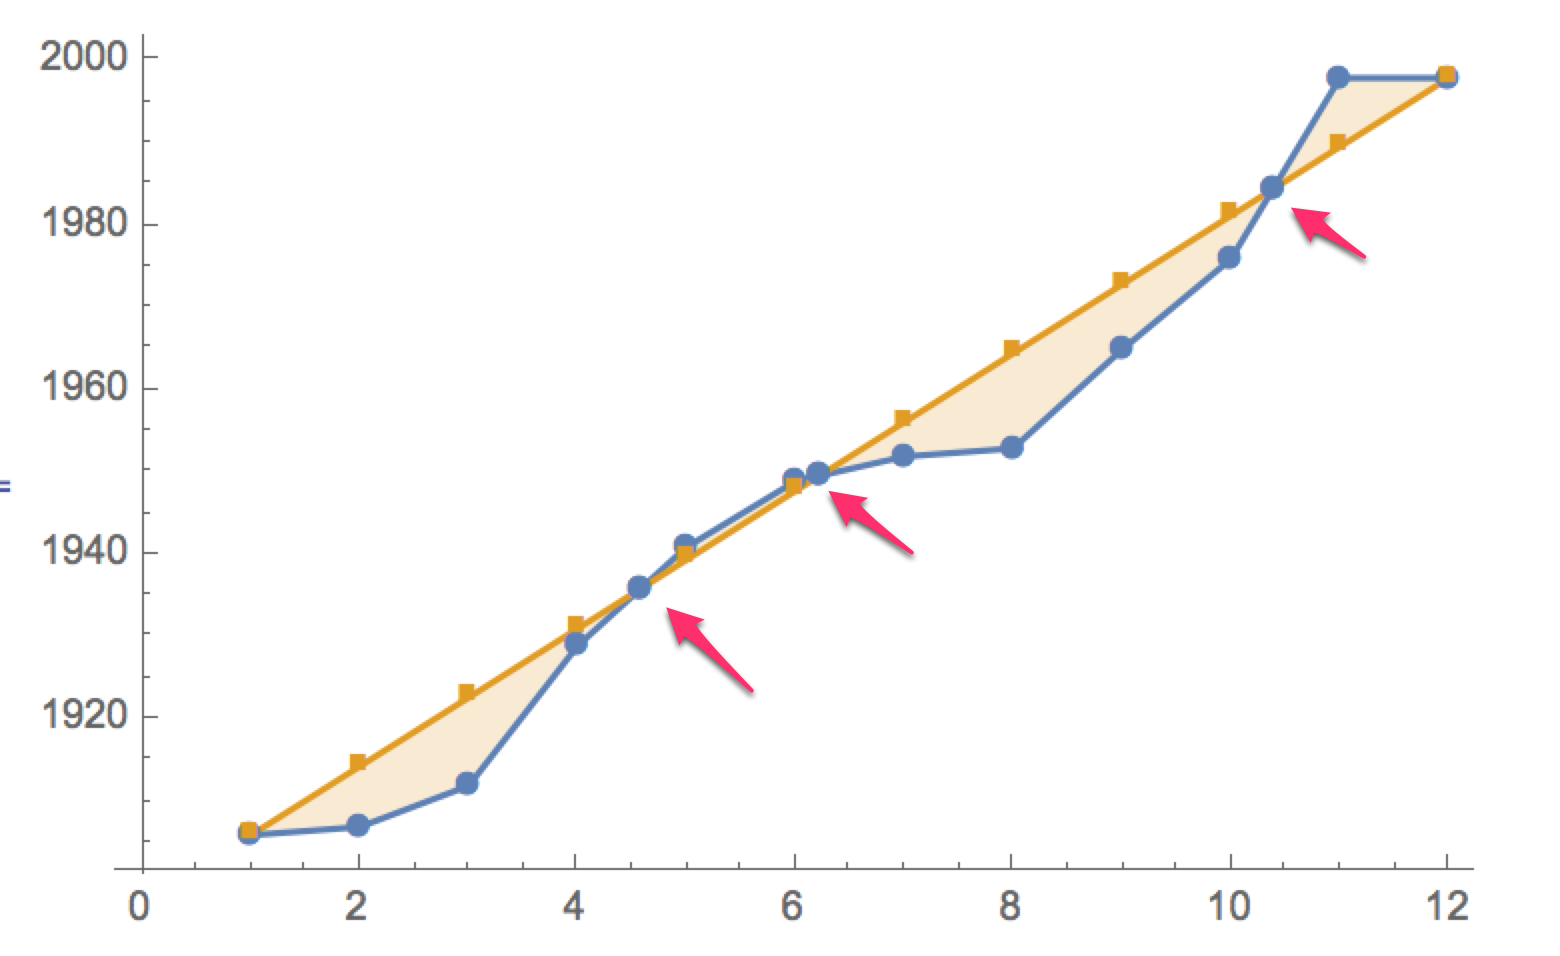
In the example below, ListPlot with PlotMarkers -> Automatic and a variant using Mesh -> All introduces extra points at crossing points, even with InterpolationOrder->None.

Is there a way to prevent these?

With[{dates = {1906, 1907, 1912, 1929, 1941, 1949, 1952, 1953, 1965, 
    1976, 1998, 1998}, evens = Range[0, 11]*(92/11) + 1906  }, 
 ListPlot[{dates, evens}, Joined -> True,
  InterpolationOrder -> None, PlotMarkers -> Automatic,
  Filling -> {1 -> {2}}]
 ]
enter image description here

$\endgroup$
4
  • 2
    $\begingroup$ Closely related: (41706) I imagine that the cause is the same. $\endgroup$
    – Mr.Wizard
    Commented Oct 19, 2014 at 19:37
  • 1
    $\begingroup$ @Mr.Wizard I don't know if they're precisely the same bug, but definitely related, and fixed in current sources, i.e. it will be in a future release. $\endgroup$
    – rcollyer
    Commented Jul 16, 2018 at 0:15
  • $\begingroup$ @rcollyer Thanks for the note! Nice to see you around. :-) $\endgroup$
    – Mr.Wizard
    Commented Jul 17, 2018 at 0:46
  • $\begingroup$ @Mr.Wizard I'm here almost everyday, whether I participate or not depends on the day. For a while there, I had the longest streak at well over a year. I believe (without evidence, of course) that my number of days present is among the top on the site. $\endgroup$
    – rcollyer
    Commented Jul 17, 2018 at 3:53

2 Answers 2

8
$\begingroup$

Using the setting Mesh->Full seems to solve the issue (in both Version 9 and 10):

With[{dates = {1906, 1907, 1912, 1929, 1941, 1949, 1952, 1953, 1965, 
    1976, 1998, 1998}, evens = Range[0, 11]*(92/11) + 1906},
 ListPlot[{dates, evens}, Joined -> True,
  Mesh -> Full, InterpolationOrder -> None,
  PlotMarkers -> Automatic, Filling -> {1 -> {2}}, ImageSize -> 400]]

enter image description here

Mesh > Details :

enter image description here

$\endgroup$
4
$\begingroup$

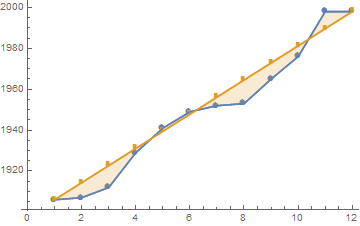
I assume the extra points are created for the filling polygon, and erroneously given a plot marker along with the "real" points. A simple workaround is just to create two plots, one with filling and one with plot markers, and combine them with Show:

With[{dates = {1906, 1907, 1912, 1929, 1941, 1949, 1952, 1953, 1965, 
    1976, 1998, 1998}, evens = Range[0, 11]*(92/11) + 1906},
 Show[
  ListPlot[{dates, evens}, Joined -> True, InterpolationOrder -> None, #] & /@ 
   {PlotMarkers -> Automatic, Filling -> {1 -> {2}}}]]

enter image description here

$\endgroup$

Your Answer

By clicking “Post Your Answer”, you agree to our terms of service and acknowledge you have read our privacy policy.

Not the answer you're looking for? Browse other questions tagged or ask your own question.