I have a video that contains object moving in one direction, is it possible to track the objects and get information like object moving speed, object length and coordinates etc.? An example would be I have a video of highway traffic, and I want to get the car size, lane number and speed for each car.
Simplified Problem
Here is a simple version of the problem:
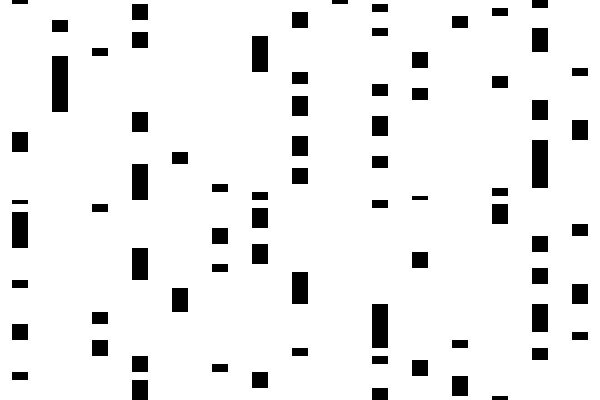
Say I have several rectangles moving in one direction, and I want to know their length and position.
The following code creates 100 frames of moving rectangles:
N0 = 100;
lengthRange = {2, 3, 4, 5};
positionRange = {1, 2, 3, 4, 5};

objectsDimension = RandomChoice[lengthRange, {N0}];(*Different possible length of rectangle*)

objectsPosition = RandomChoice[positionRange, {N0}];(* Track number for the rectangle*)

objectsEndPoins = Transpose /@ Transpose[{Transpose[{objectsPosition - 0.2, objectsPosition + 0.2}], Partition[Prepend[Accumulate[objectsDimension], 0], 2, 1] /. {x_, y_} -> {x + 0.2, y - 0.2}}];
(* coordinates for rectangles*)

timePlot = Graphics[Rectangle @@@ objectsEndPoins, ImageSize -> {200, Automatic}, AspectRatio -> 8];(* the whole time plot*)

frames = Table[Show[timePlot, PlotRange -> {{1 - 0.5, 5 + 0.5}, {n, n + 50}}, AspectRatio -> 1, ImageSize -> {200, Automatic}], {n, 0, 300, 3}];(*show different part of the whole plot, to create video frames*)

frames = Graphics[#[[1]], Sequence @@ Options[#]] & /@ frames;(*workaround of [this][1] problem*)

ListAnimate[frames]

So can we get the coordinates and the length of the rectangles in the video?
What I tried
I first use the FindGeometricTransform find the speed for the moving objects, then stack each frame together to get a whole time plot, then measure the rectangles.
stepPerFrame = Mean@Table[FindGeometricTransform[frames[[i]], frames[[i + 1]], TransformationClass -> "Translation"][[2, 1, 2, 3]], {i, 1, 20}]
  (*calculate the object moving speed per frame. Assume constant speed, average speed for the first 20 frames.*)

blank = Graphics[{}, ImageSize -> ImageDimensions[timePlot]];(*constract a blank plot*)

result = ImagePad[Block[{tmp = blank},
    Do[tmp =
       ImageCompose[tmp,
        frames[[i]], {0, (i - 1)*stepPerFrame}, {0, 0}];, {i, 1,
      Length@frames}];
    tmp], {{0, 0}, {10, 0}},
   White];
(*stack each frame together with a offset of object moving speed.*)

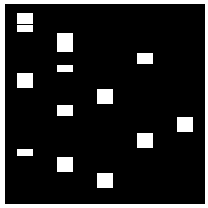
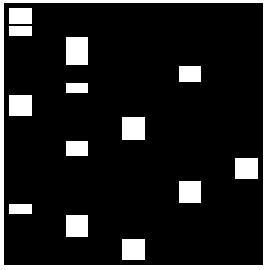
imageData = ImageData[Binarize[ColorNegate[result]]];(*binarize the image*)

lines = Reverse /@
   Transpose[
    imageData[[All,
     Range[20, 180, 40]]]];(*outlines at each lane center*)

position =
  Table[lines[[
      n]] //. {x__, PatternSequence[0, 1], y__} -> {x, 0, "start",
       y} //. {x__, PatternSequence[1, 0], y__} -> {x, "stop", 0,
      y}, {n, 1, 5}];(*mark object start and stop in the data *)

objects =
  Table[(Transpose@{Flatten[Position[position[[n]], "start"]],
      Flatten[Position[position[[n]], "stop"]]}), {n, 1,
    5}];(*select the object start and stop position*)

recoveredOjbDim =
  Flatten[Differences /@ Sort@Flatten[objects, 1]] /. {5 -> 2, 9 -> 3,
     13 -> 4, 17 -> 5};(*calculate the object length*)

recoveredOjbDim == objectsDimension(*compare to the correct answer*)
(*True*)
Questions:
- Could you show your methods, I'm sure I can learn a lot.
- In the problem, all objects have the same constant speed, what can we do for objects with different speed?


ImageFeatureTrack[]if you don't need a robust real life app. $\endgroup$