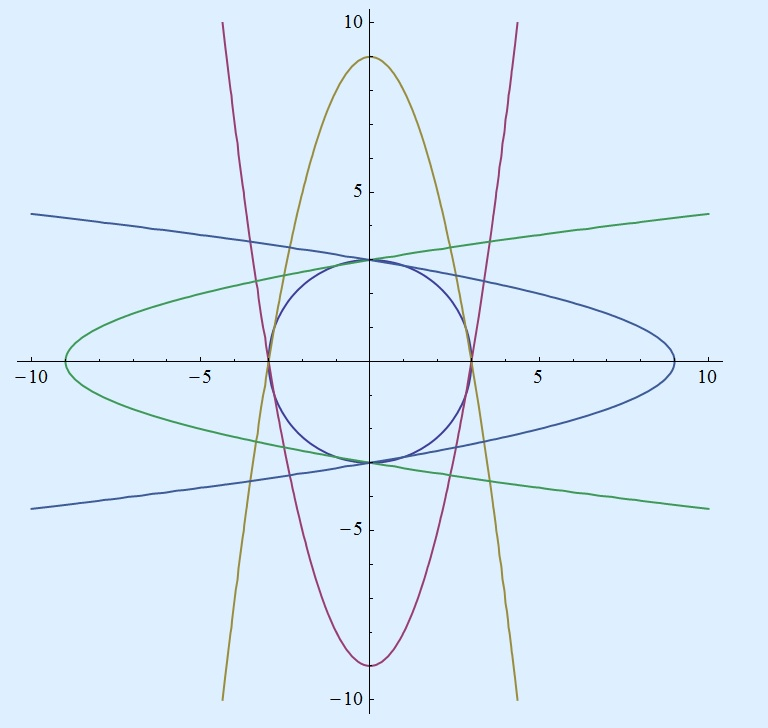
Basically you have to plot 4 equations [$\pm y^2 = b(x\pm a);\pm x^2 = b(y\pm a)$]. So try to get the roots of them first.
{s11[s_, x_], s12[s_, x_]} = y /. Solve[s y^2 == b (x + s a), y]
{s2[s_, x_]} = y /. Solve[s x^2 == b (y + s a), y]
Second one is linear in y, so only 1 root. $s=\pm 1$ which will give you different equations. $a,b$ are parameters to adjust the position and broadening of your parabola. Now create a new function like $\prod (y-y_i(x))$, where $y_i(x)$ is i-th solution for y.
fun[x_, y_] = Product[(y - s11[s, x]) (y - s12[s, x]) (y - s2[s, x]), {s, {-1,1}}] // Simplify
Your desired function is (use fun[x, y] // Expand)
$fun[x,y] = -a^4 b^2+2 a^3 b x^2+2 a^3 b y^2+a^2 b^2 x^2+a^2 b^2 y^2-a^2 x^4-4 a^2 x^2 y^2-a^2 y^4+\frac{2 a x^4 y^2}{b}-2 a b x^4+\frac{2 a x^2 y^4}{b}-2 a b y^4-\frac{x^4 y^4}{b^2}-b^2 x^2 y^2+x^6+y^6$
Now plot it with some value for a and b. For your desired figure $a=7.5, b=1/4$ works nicely.
a = 7.5; b = .25;
ContourPlot[fun[x, y] == 0, {x, -10, 10}, {y, -10, 10}, Axes -> True, MaxRecursion -> 5]
Circle in the middle and Parameter value
I forgot to draw the circle in the middle. Just add x^2+y^2==c^2 as another contour function, or define a new function as
fun1[x_,y_] = fun[x,y](x^2+y^2-c^2)
For the figure above the parameter a, b and c will be
a = 9; b = 1; c=3;
ContourPlot[fun1[x, y] == 0, {x, -10, 10}, {y, -10,   10}, Axes -> True, Frame -> False, MaxRecursion -> 5]

