5
$\begingroup$

I want to add coordinate axis to a figure of nested spheres.

I have the command.

Graphics3D[Table[{Opacity[.6], Specularity[White, 20], Sphere[{0, 0, 0}, r]}, 
{r, 1/2, 3, 1/2}], Boxed -> False]

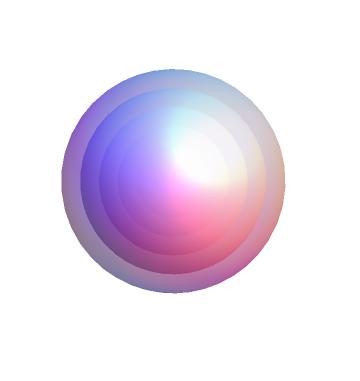
Which reproduces the set of nested spheres

enter image description here

Now, I would need to add axes X, Y and Z

It would also be good to be able to label the spheres 1, 2, 3...

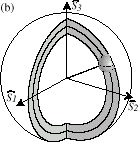
Thanks Edit: and to do something similar to this picture?

enter image description here

$\endgroup$
2
  • 1
    $\begingroup$ Add , Axes -> True, AxesOrigin -> {0, 0, 0} for the axes. You can take a look at Inset for the labels. $\endgroup$
    – Öskå
    Commented May 12, 2014 at 18:24
  • 1
    $\begingroup$ SphericalPlot3D[{1, 2, 3}, {\[Theta], 0, Pi}, {\[Phi], 0, 3 Pi/2}, Mesh -> None, Boxed -> False, Axes -> True, AxesOrigin -> {0, 0, 0}, PlotStyle -> Directive[Opacity[.6], Specularity[White, 20]]]? $\endgroup$
    – kglr
    Commented May 12, 2014 at 18:56

2 Answers 2

11
$\begingroup$

From the documentation of SphericalPlot3D you can find:

SphericalPlot3D[{1, 2, 3}, {θ, 0, Pi}, {ϕ, 0, 3 Pi/2}]

Thus, you can modify it a little:

r = {1, 2, 3};
col = [email protected];
opts = {Mesh -> None, Boxed -> False, Axes -> False};
spheres = SphericalPlot3D[Evaluate@r, {\[Theta], 0, Pi}, {\[Phi], 0, 3 Pi/2}, 
  Evaluate@opts, PlotStyle -> (Directive[Opacity@(1/#), col] & /@ r)];
(*axes and labels*)
al = Graphics3D[{Style[Text[#, RotateLeft@#2], Bold, 15] & @@@ 
  Thread[{{"X", "Y", "Z"}, RotateRight[{Max@r + Max@r/10, 0, 0}, #] & /@ {0, 1, 2}}], 
  Inset[Style[#, Bold, 20], {(Sqrt@2)/2 #, 0, (Sqrt@2)/2 #}] & /@ r}, 
  PlotRange -> Max@r, Boxed -> False, Axes -> True, AxesOrigin -> {0, 0, 0}];
filling[{rmin_, rmax_}] := ParametricPlot3D[{r*{0, -1 Sin[t], Cos[t]}, 
  r*{Sin[t], 0, Cos[t]}}, {r, rmin, rmax}, {t, 0, Pi}, 
  Evaluate@opts, PlotStyle -> (Directive[EdgeForm[], [email protected], col])];
Show[{al, spheres, filling[{0, Min@r}], filling[r[[2 ;; 3]]]}]
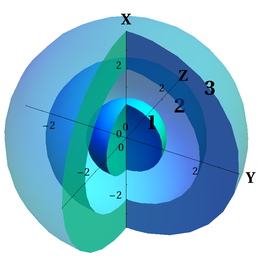
enter image description here


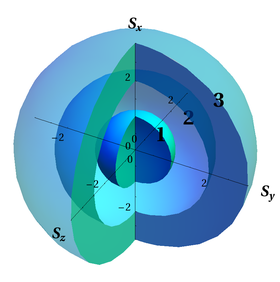
Edit:

It's now easier to chose where to place the axes labels:

r = {1, 2, 3};
col = [email protected];
opts = {Mesh -> None, Boxed -> False, Axes -> False};
spheres = SphericalPlot3D[Evaluate@r, {\[Theta], 0, Pi}, {\[Phi], 0, 3 Pi/2}, 
  Evaluate@opts, PlotStyle -> (Directive[Opacity@(1/#), col] & /@ r)];
(*axes and labels*)
al = Graphics3D[{Style[Text[#, RotateLeft@#2], Bold, 15] & @@@ 
  {{Subscript[S, x], {Max@r + .5, 0, 0}}, 
   {Subscript[S, x], {0, Max@r + .5, 0}}, 
   {Subscript[S, x], {0, 0, -Max@r - .5}}}, 

  Inset[Style[#, Bold, 20], {(Sqrt@2)/2 #, 0, (Sqrt@2)/2 #}] & /@ r}, 
  PlotRange -> Max@r, Boxed -> False, Axes -> True, AxesOrigin -> {0, 0, 0}];
filling[{rmin_, rmax_}] := ParametricPlot3D[{r*{0, -1 Sin[t], Cos[t]}, 
  r*{Sin[t], 0, Cos[t]}}, {r, rmin, rmax}, {t, 0, Pi}, 
  Evaluate@opts, PlotStyle -> (Directive[EdgeForm[], [email protected], col])];
Show[{al, spheres, filling[{0, Min@r}], filling[r[[2 ;; 3]]]}]
Mathematica graphics

$\endgroup$
2
  • $\begingroup$ This looks very good, lots of thanks. However I've written in the Axes "S_x","S_y" and "S_z" meanwhile the label for S_x is easy to recognize, when printing it's hard to see the other labels cause the background is not white. I would like to write the label (in your plot the Z) in the other extreme and the lift the label X a litle bit $\endgroup$
    – Popeye
    Commented May 20, 2014 at 11:18
  • $\begingroup$ @user10712 check the edit. $\endgroup$
    – Öskå
    Commented May 20, 2014 at 11:40
11
$\begingroup$
options = {Mesh -> None, Boxed -> False, Axes -> True,  AxesOrigin -> {0, 0, 0}, 
   PlotStyle -> Directive[Opacity[.6], Specularity[White, 20]], ImageSize -> 500};
SphericalPlot3D[{1, 2, 3}, {t, 0, Pi}, {p , 0, 3 Pi/2},  Evaluate@options]

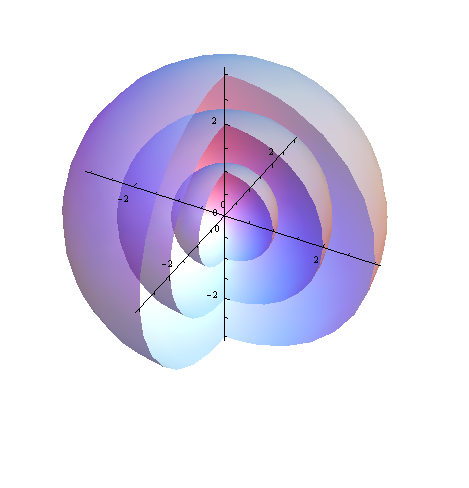
enter image description here

or

ParametricPlot3D[{Cos[u] Sin[v], Sin[u] Sin[v], Cos[v]} # & /@ {1, 2, 3}, 
  {v, 0, Pi}, {u, 0, 2 Pi}, 
  Evaluate@options, RegionFunction -> Function[{x, y}, x y > 0 || y > 0]]

or

ContourPlot3D[x^2 + y^2 + z^2, {x, -2, 2}, {y, -2, 2}, {z, -2, 2}, 
   Contours -> {1, 2, 3}, Evaluate[options /. PlotStyle -> ContourStyle],
   BoundaryStyle -> None, RegionFunction -> Function[{x, y}, x y > 0 || y > 0]]

or

Show[RevolutionPlot3D[{# Cos[t], # Sin[t]}, {t, -Pi/2, Pi/2}, {v, Pi/2, 2 Pi},
     Evaluate@options] & /@ {3, 2, 1}]
$\endgroup$

Your Answer

By clicking “Post Your Answer”, you agree to our terms of service and acknowledge you have read our privacy policy.

Not the answer you're looking for? Browse other questions tagged or ask your own question.