added 136 characters in body
Source Link
kglr
  • 400.5k
  • 18
  • 488
  • 929
options = {Mesh -> None, Boxed -> False, Axes -> True,  AxesOrigin -> {0, 0, 0}, 
   PlotStyle -> Directive[Opacity[.6], Specularity[White, 20]], ImageSize -> 500};
SphericalPlot3D[{1, 2, 3}, {t, 0, Pi}, {p , 0, 3 Pi/2},  Evaluate@options]
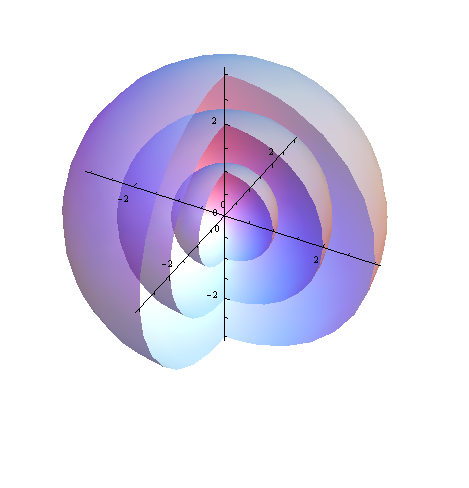
enter image description here

or

ParametricPlot3D[{Cos[u] Sin[v], Sin[u] Sin[v], Cos[v]} # & /@ {1, 2, 3}, 
  {v, 0, Pi}, {u, 0, 2 Pi}, 
  Evaluate@options, RegionFunction -> Function[{x, y}, x y > 0 || y > 0]]

or

 ContourPlot3D[x^2 + y^2 + z^2, {x, -2, 2}, {y, -2, 2}, {z, -2, 2}, 
   Contours -> {1, 2, 3}, Evaluate[options /. PlotStyle -> ContourStyle],
   BoundaryStyle -> None, RegionFunction -> Function[{x, y}, x y > 0 || y > 0]]

or

Show[RevolutionPlot3D[{# Cos[t], # Sin[t]}, {t, -Pi/2, Pi/2}, {v, Pi/2, 2 Pi},
     Evaluate@options] & /@ {3, 2, 1}]
options = {Mesh -> None, Boxed -> False, Axes -> True,  AxesOrigin -> {0, 0, 0}, 
   PlotStyle -> Directive[Opacity[.6], Specularity[White, 20]], ImageSize -> 500};
SphericalPlot3D[{1, 2, 3}, {t, 0, Pi}, {p , 0, 3 Pi/2},  Evaluate@options]

enter image description here

or

ParametricPlot3D[{Cos[u] Sin[v], Sin[u] Sin[v], Cos[v]} # & /@ {1, 2, 3}, 
  {v, 0, Pi}, {u, 0, 2 Pi}, 
  Evaluate@options, RegionFunction -> Function[{x, y}, x y > 0 || y > 0]]

or

 ContourPlot3D[x^2 + y^2 + z^2, {x, -2, 2}, {y, -2, 2}, {z, -2, 2}, 
   Contours -> {1, 2, 3}, Evaluate[options /. PlotStyle -> ContourStyle],
   BoundaryStyle -> None, RegionFunction -> Function[{x, y}, x y > 0 || y > 0]]
options = {Mesh -> None, Boxed -> False, Axes -> True,  AxesOrigin -> {0, 0, 0}, 
   PlotStyle -> Directive[Opacity[.6], Specularity[White, 20]], ImageSize -> 500};
SphericalPlot3D[{1, 2, 3}, {t, 0, Pi}, {p , 0, 3 Pi/2},  Evaluate@options]

enter image description here

or

ParametricPlot3D[{Cos[u] Sin[v], Sin[u] Sin[v], Cos[v]} # & /@ {1, 2, 3}, 
  {v, 0, Pi}, {u, 0, 2 Pi}, 
  Evaluate@options, RegionFunction -> Function[{x, y}, x y > 0 || y > 0]]

or

ContourPlot3D[x^2 + y^2 + z^2, {x, -2, 2}, {y, -2, 2}, {z, -2, 2}, 
   Contours -> {1, 2, 3}, Evaluate[options /. PlotStyle -> ContourStyle],
   BoundaryStyle -> None, RegionFunction -> Function[{x, y}, x y > 0 || y > 0]]

or

Show[RevolutionPlot3D[{# Cos[t], # Sin[t]}, {t, -Pi/2, Pi/2}, {v, Pi/2, 2 Pi},
     Evaluate@options] & /@ {3, 2, 1}]
added 375 characters in body
Source Link
kglr
  • 400.5k
  • 18
  • 488
  • 929
options = {Mesh -> None, Boxed -> False, Axes -> True,  AxesOrigin -> {0, 0, 0}, 
   PlotStyle -> Directive[Opacity[.6], Specularity[White, 20]], ImageSize -> 500};
SphericalPlot3D[{1, 2, 3}, {t, 0, Pi}, {p , 0, 3 Pi/2},  Evaluate@options]

enter image description here

or

ParametricPlot3D[
  Evaluate@Through[{1 #Cos[u] &Sin[v], 2 #Sin[u] &Sin[v], 3Cos[v]} # &}[{Cos[u] Sin[v],/@ Sin[u]{1, Sin[v]2, Cos[v]3}]], 
  {v, 0, Pi}, {u, 0, 2 Pi}, 
  Evaluate@options, RegionFunction -> Function[{x, y}, x y > 0 || y > 0]]

or

 ContourPlot3D[x^2 + y^2 + z^2, {x, -2, 2}, {y, -2, 2}, {z, -2, 2}, 
   Contours -> {1, 2, 3}, Evaluate[options /. PlotStyle -> ContourStyle],
   BoundaryStyle -> None, RegionFunction -> Function[{x, y}, x y > 0 || y > 0]]
options = {Mesh -> None, Boxed -> False, Axes -> True,  AxesOrigin -> {0, 0, 0}, 
   PlotStyle -> Directive[Opacity[.6], Specularity[White, 20]], ImageSize -> 500};
SphericalPlot3D[{1, 2, 3}, {t, 0, Pi}, {p , 0, 3 Pi/2},  Evaluate@options]

enter image description here

or

ParametricPlot3D[
  Evaluate@Through[{1 # &, 2 # &, 3 # &}[{Cos[u] Sin[v], Sin[u] Sin[v], Cos[v]}]], 
  {v, 0, Pi}, {u, 0, 2 Pi}, 
  Evaluate@options, RegionFunction -> Function[{x, y}, x y > 0 || y > 0]]

or

 ContourPlot3D[x^2 + y^2 + z^2, {x, -2, 2}, {y, -2, 2}, {z, -2, 2}, 
   Contours -> {1, 2, 3}, Evaluate[options /. PlotStyle -> ContourStyle],
   BoundaryStyle -> None, RegionFunction -> Function[{x, y}, x y > 0 || y > 0]]
options = {Mesh -> None, Boxed -> False, Axes -> True,  AxesOrigin -> {0, 0, 0}, 
   PlotStyle -> Directive[Opacity[.6], Specularity[White, 20]], ImageSize -> 500};
SphericalPlot3D[{1, 2, 3}, {t, 0, Pi}, {p , 0, 3 Pi/2},  Evaluate@options]

enter image description here

or

ParametricPlot3D[{Cos[u] Sin[v], Sin[u] Sin[v], Cos[v]} # & /@ {1, 2, 3}, 
  {v, 0, Pi}, {u, 0, 2 Pi}, 
  Evaluate@options, RegionFunction -> Function[{x, y}, x y > 0 || y > 0]]

or

 ContourPlot3D[x^2 + y^2 + z^2, {x, -2, 2}, {y, -2, 2}, {z, -2, 2}, 
   Contours -> {1, 2, 3}, Evaluate[options /. PlotStyle -> ContourStyle],
   BoundaryStyle -> None, RegionFunction -> Function[{x, y}, x y > 0 || y > 0]]
added 375 characters in body
Source Link
kglr
  • 400.5k
  • 18
  • 488
  • 929
options = {Mesh -> None, Boxed -> False, Axes -> True,  AxesOrigin -> {0, 0, 0}, 
   PlotStyle -> Directive[Opacity[.6], Specularity[White, 20]], ImageSize -> 500};
SphericalPlot3D[{1, 2, 3}, {t, 0, Pi}, {p , 0, 3 Pi/2},  Evaluate@options]

enter image description here

or

ParametricPlot3D[
  Evaluate@Through[{1 # &, 2 # &, 3 # &}[{Cos[u] Sin[v], Sin[u] Sin[v], Cos[v]}]], 
  {v, 0, Pi}, {u, 0, 2 Pi}, 
  Evaluate@options, RegionFunction -> Function[{x, y}, x y > 0 || y > 0]]

or

 ContourPlot3D[x^2 + y^2 + z^2, {x, -2, 2}, {y, -2, 2}, {z, -2, 2}, 
   Contours -> {1, 2, 3}, Evaluate[options /. PlotStyle -> ContourStyle],
   BoundaryStyle -> None, RegionFunction -> Function[{x, y}, x y > 0 || y > 0]]
options = {Mesh -> None, Boxed -> False, Axes -> True,  AxesOrigin -> {0, 0, 0}, 
   PlotStyle -> Directive[Opacity[.6], Specularity[White, 20]], ImageSize -> 500};
SphericalPlot3D[{1, 2, 3}, {t, 0, Pi}, {p , 0, 3 Pi/2},  Evaluate@options]

enter image description here

or

ParametricPlot3D[
  Evaluate@Through[{1 # &, 2 # &, 3 # &}[{Cos[u] Sin[v], Sin[u] Sin[v], Cos[v]}]], 
  {v, 0, Pi}, {u, 0, 2 Pi}, 
  Evaluate@options, RegionFunction -> Function[{x, y}, x y > 0 || y > 0]]

or

 ContourPlot3D[x^2 + y^2 + z^2, {x, -2, 2}, {y, -2, 2}, {z, -2, 2}, 
   Contours -> {1, 2, 3}, Evaluate[options /. PlotStyle -> ContourStyle],
   BoundaryStyle -> None, RegionFunction -> Function[{x, y}, x y > 0 || y > 0]]
added 279 characters in body
Source Link
kglr
  • 400.5k
  • 18
  • 488
  • 929
Loading
Source Link
kglr
  • 400.5k
  • 18
  • 488
  • 929
Loading