Some Chemistry data sets
I am trying to plot some titration data with Mathematica. I have done 4 experiments and gathered around 70 pH points (one for each milliliter) during each session, and therefore I have 4 sets of pH measurements. Now, in each experiment I used a different concentration of an extra compound (something that affects the titration), so the curves should, when plotted in 3D, show a nice behavior, since the precipitant forces the protons out of the acid (the Chemistry part here; may ignore).
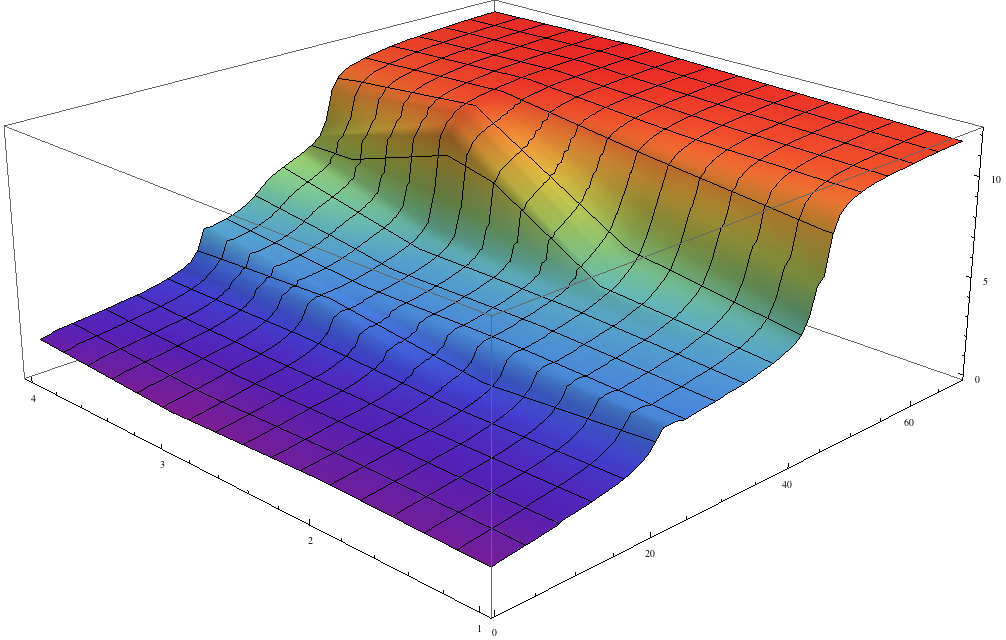
Now, this curves are not meant to be plotted with equals distances, as in the image and what I've managed to do.

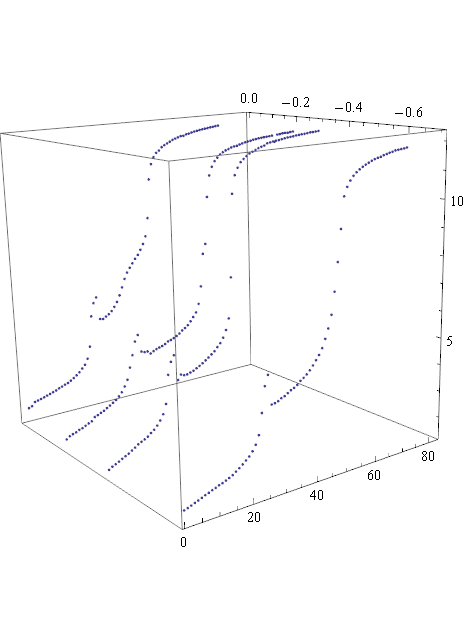
The standard why of plotting these 4 curves is by placing them at the $\log_{10}$ of the concentration of the extra compound ($\text{CaCl}_2$ for those who might be interested). My data looks like this:
L1 = {1.63, 1.67, 1.71, 1.76, 1.80, 1.85, 1.90, 1.94, 1.99, 2.03,
  2.08, 2.11, 2.16, 2.21, 2.27, 2.35, 2.43, 2.52, 2.62, 2.72, 2.86,
  3.05, 3.34, 4.06, 4.93, 5.28, 4.25, 4.26, 4.30, 4.37, 4.41, 4.48,
  4.55, 4.60, 4.67, 4.78, 4.85, 4.94, 5.05, 5.19, 5.34, 5.49, 5.70,
  5.99, 6.32, 6.76, 7.52, 8.49, 9.56, 10.61, 10.90, 11.09, 11.23,
  11.33, 11.41, 11.48, 11.54, 11.59, 11.64, 11.68, 11.71, 11.73,
  11.77, 11.80, 11.83, 11.85, 11.88, 11.89, 11.90, 11.91, 11.93}

L2 = {1.36, 1.44, 1.49, 1.55, 1.62, 1.68, 1.74, 1.82, 1.89, 1.98,
  2.04, 2.09, 2.16, 2.26, 2.35, 2.47, 2.63, 2.83, 3.18, 4.23, 4.68,
  4.89, 3.95, 4.12, 4.07, 4.07, 4.11, 4.15, 4.21, 4.27, 4.34, 4.42,
  4.50, 4.59, 4.68, 4.81, 4.93, 5.11, 5.37, 5.78, 7.28, 10.28, 10.92,
  11.17, 11.35, 11.45, 11.54, 11.62, 11.67, 11.72, 11.77, 11.81,
  11.84, 11.91, 11.93, 11.95, 11.97, 11.98, 12.00, 12.02, 12.04,
  12.05, 12.06, 12.08, 12.09, 12.10, 12.11, 12.12, 12.14, 12.14,
  12.15, 12.16}

L3 = {1.48, 1.57, 1.62, 1.66, 1.72, 1.75, 1.81, 1.87, 1.92, 2.06,
  2.10, 2.16, 2.21, 2.28, 2.35, 2.43, 2.51, 2.62, 2.75, 2.95, 3.19,
  3.64, 4.10, 4.61, 4.84, 4.16, 4.11, 4.11, 4.00, 4.07, 4.12, 4.16,
  4.19, 4.24, 4.32, 4.35, 4.40, 4.46, 4.53, 4.63, 4.70, 4.79, 4.92,
  5.07, 5.23, 5.55, 6.23, 7.50, 7.87, 9.68, 10.49, 10.81, 11.01,
  11.13, 11.24, 11.31, 11.37, 11.41, 11.46, 11.49, 11.50, 11.54,
  11.57, 11.60, 11.62, 11.64, 11.67, 11.68, 11.70, 11.71, 11.72,
  11.73, 11.74, 11.75, 11.5, 11.77, 11.78, 11.80, 11.81, 11.80, 11.82,
   11.83}

L4 = {1.79, 1.84, 1.98, 2.01, 2.04, 2.08, 2.12, 2.16, 2.20, 2.24,
  2.30, 2.34, 2.39, 2.43, 2.50, 2.58, 2.66, 2.76, 2.89, 3.02, 3.24,
  3.72, 4.95, 5.47, 5.68, 4.77, 4.74, 4.82, 4.89, 5.00, 5.15, 5.33,
  5.58, 5.89, 6.22, 6.46, 6.64, 6.80, 6.97, 7.11, 7.30, 7.52, 7.82,
  8.55, 10.10, 10.70, 10.97, 11.13, 11.21, 11.33, 11.40, 11.46, 11.52,
   11.58, 11.62, 11.66, 11.70, 11.70, 11.75, 11.77, 11.80, 11.83,
  11.85, 11.87, 11.89, 11.91, 11.92, 11.94, 11.95, 11.97, 11.98}

L5 = {2.07, 2.09, 2.12, 2.17, 2.23, 2.26, 2.28, 2.31, 2.41, 2.45,
   2.48, 2.52, 2.58, 2.63, 2.69, 2.76, 2.85, 2.95, 3.14, 3.28, 3.48,
   3.82, 5.11, 5.76, 6.06, 6.23, 5.72, 5.83, 6.05, 6.28, 6.47, 6.50,
   6.70, 6.82, 6.96, 7.08, 7.18, 7.22, 7.35, 7.47, 7.60, 7.74, 7.91,
   8.15, 8.51, 9.54, 10.17, 10.63, 10.98, 11.22, 11.37, 11.49, 11.59,
   11.68, 11.74, 11.79, 11.84, 11.90, 11.92, 11.95, 12.02, 12.07,
   12.11, 12.15, 12.18, 12.20, 12.22, 12.24, 12.25, 12.28, 12.31,
   12.34, 12.36}
So, each value there is the y-value, the number of item is the x-value and the z-value (or whatever it must be) is, for each complete set, the logarithm of the concentration.
Any help is appreciated!
Example (extract from L1):
L = {{1.63,0,-0.7}, {1.67,1,-0.7}, {1.71,2,-0.7}, {1.76,3,-0.7}, {1.80,4,-0.7}, {1.85,5,-0.7}}
The coordinates:
{{L3, L1, L2, L4, L5}, {Log10[0.199], Log10[0.099], Log10[0.15],
  Log10[0.054], Log10[0.0265]}}


-0.7. Assume I know nothing about your field or process (which is probably close to correct). $\endgroup$