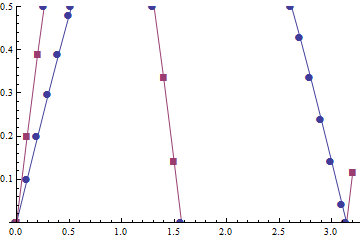
Bug introduced in 7.0 or earlier and persisting through 11.3
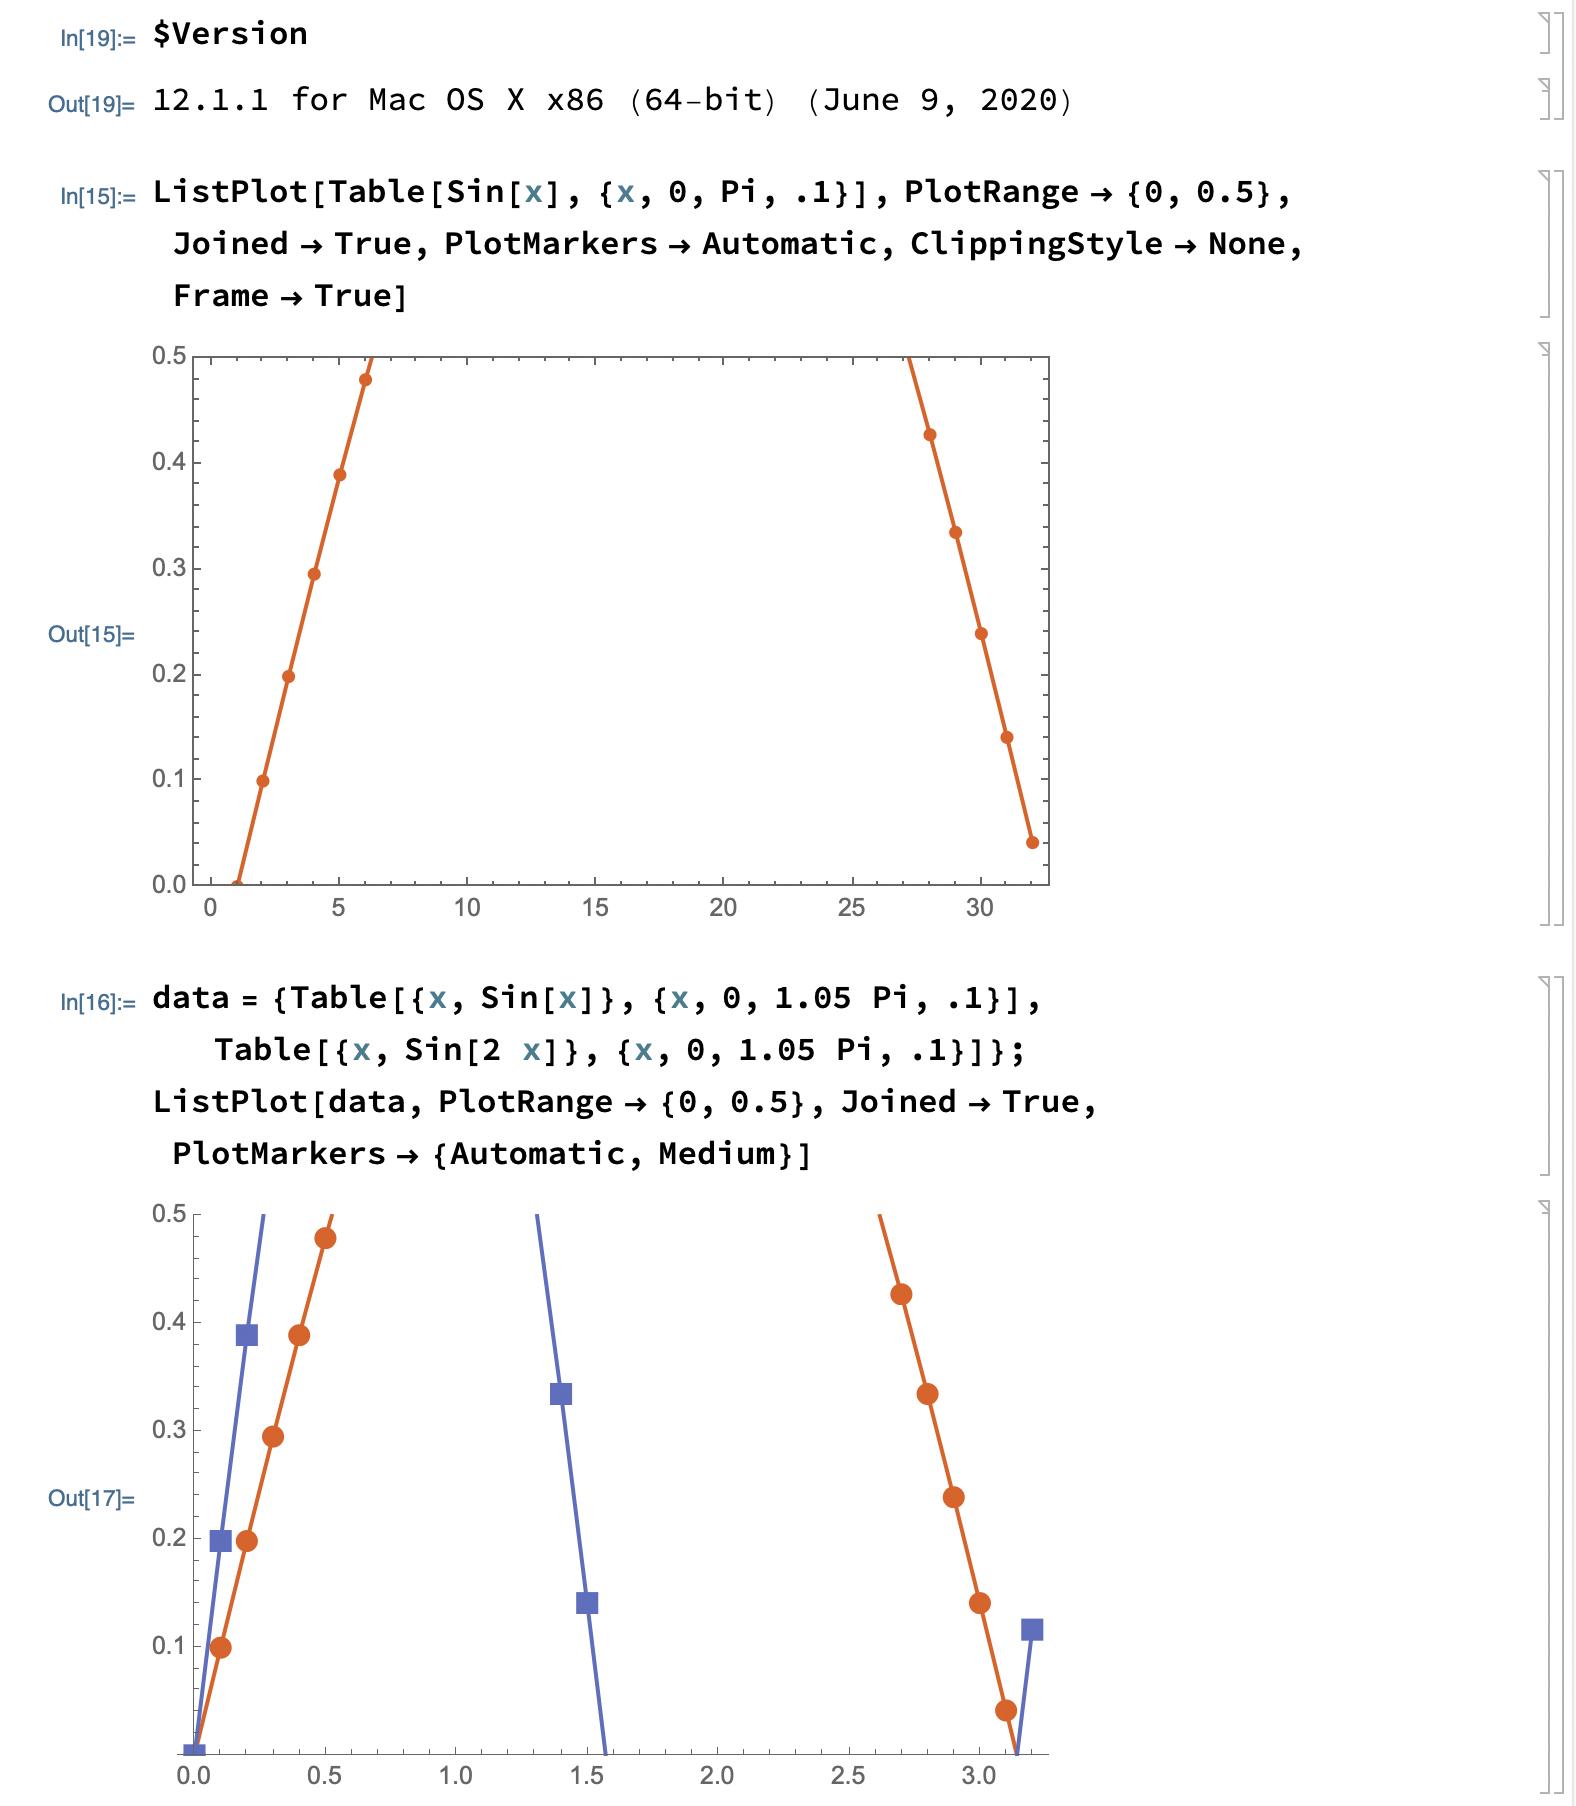
In this simple code
ListPlot[Table[Sin[x], {x, 0, Pi, .1}], PlotRange -> {0, 0.5},
 Joined -> True, PlotMarkers -> Automatic, ClippingStyle -> None, Frame -> True]

We can see that there are two PlotMarkers appear at the clipped boundary. But actually there are not points, so they should not exist. How can we remove them? I have already used ClippingStyle -> None.
Update
As Alexey Popkov pointed out, this is really a bug. If we play with this code
data = {Table[{x, Sin[x]}, {x, 0, 1.05 Pi, .1}], Table[{x, Sin[2 x]}, {x, 0, 1.05 Pi, .1}]};
ListPlot[data, PlotRange -> {0, 0.5}, Joined -> True, PlotMarkers -> {Automatic, Medium}]

Now, even the same plot marker will be used for all data sets at the clipped boundaries, both top and bottom.


Joined -> TruewithPlotMarkers -> Automaticand default values forClippingStyleandPlotRangePaddingproduces spurious plot markers at the edges of plot. Here is better example:ListPlot[Table[{x, Sin[x]}, {x, 0, 1.05 Pi, .1}], PlotRange -> {0, 0.5}, Joined -> True, PlotMarkers -> Automatic]. $\endgroup$