2
$\begingroup$

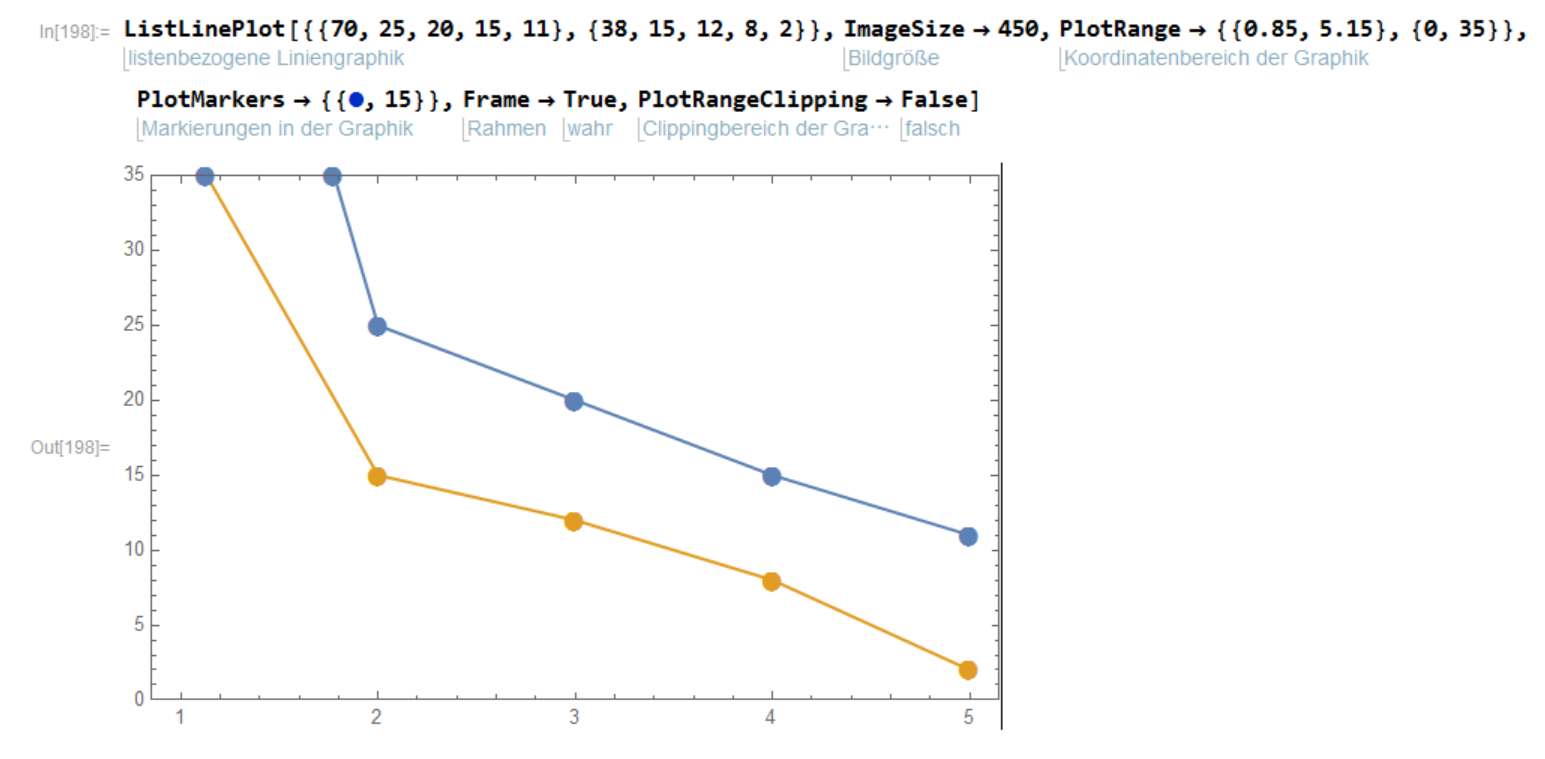
I am well aware I could simply increase the PlotRange to fix this, however, I'd like to keep the scale identical to some plots I compare this with. Also I haven't found anything about this and it only happens when I put a frame around my plots.

Initially I thought the outlying observation is styled just like the respective line, but that is not the case it seems.

plots were created with Mathematica 11

edit:

PlotRangeClipping False/True only allows to display the full circle (as in the image) or clip it, but there do not seem to be any options to actually style (change color or shape of the marker) or remove any indication of clipping.

edit2:

So here's an example with some simple code. Notice the blue indication where the lines leave the plot. I'd like to change the appearance of these.

 ListLinePlot[{{70, 25, 20, 15, 11}, {38, 15, 12, 8, 2}}, 
 ImageSize -> 450, PlotRange -> {{0.85, 5.15}, {0, 35}}, 
 PlotMarkers -> {{\[FilledCircle], 15}}, Frame -> True, 
 PlotRangeClipping -> False]

enter image description here

$\endgroup$
4
  • $\begingroup$ To be more precise, i was wondering if one could control the "clipping" indication, to have anything else than a red circle. And thank you for your answer, i'll try finding more information on Clipping. $\endgroup$
    – Andreas
    Commented Sep 7, 2016 at 20:26
  • 1
    $\begingroup$ I fear that might be a bug and not a clipping indicator ... $\endgroup$
    – Szabolcs
    Commented Sep 7, 2016 at 20:49
  • $\begingroup$ Since a moderator closed this question so quickly, I can't post this as a answer, but there is a work-around. if you assign your plot to a variable, say plot, then DeleteCases[plt, {{_, 35.`}}, ∞] will give a plot without the bogus markers. $\endgroup$
    – m_goldberg
    Commented Sep 7, 2016 at 22:18
  • $\begingroup$ This does the same in my case as what Szabolcs noted (ClippingStyle->False). See also here mathematica.stackexchange.com/a/41708/42848 $\endgroup$
    – Andreas
    Commented Sep 8, 2016 at 6:05

1 Answer 1

4
$\begingroup$

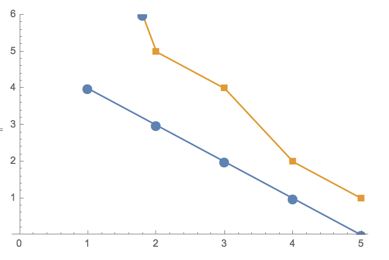
I am sorry to have to say this, but that is not a clipping indicator. It is a bug in ListPlot. Here's a simple way to reproduce it:

ListPlot[{{4, 3, 2, 1, 0}, {10, 5, 4, 2, 1}}, Joined -> True, 
 PlotMarkers -> {Automatic, 15}, PlotRange -> {0, 6}]

enter image description here

Notice that where the second (yellow) line is clipped, a plot marker of the first line has appeared. This might have been discussed on this site before, but I'm lazy to search for it (anyone else?). Update: Here's a mention. Workaround is ClippingStyle -> False, which makes it go away.

Please do report this misbehaviour to Wolfram Support. If more people report it, there's a higher chance that it'll get fixed.

$\endgroup$

Not the answer you're looking for? Browse other questions tagged or ask your own question.