24
$\begingroup$

Bug introduced in 7.0 or earlier and persisting through 11.3


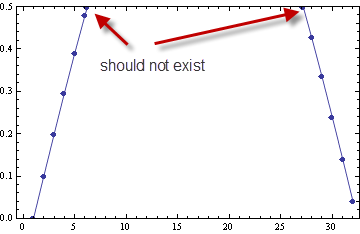
In this simple code

ListPlot[Table[Sin[x], {x, 0, Pi, .1}], PlotRange -> {0, 0.5},
 Joined -> True, PlotMarkers -> Automatic, ClippingStyle -> None, Frame -> True]
enter image description here

We can see that there are two PlotMarkers appear at the clipped boundary. But actually there are not points, so they should not exist. How can we remove them? I have already used ClippingStyle -> None.


Update

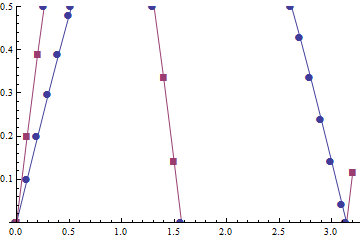
As Alexey Popkov pointed out, this is really a bug. If we play with this code

data = {Table[{x, Sin[x]}, {x, 0, 1.05 Pi, .1}], Table[{x, Sin[2 x]}, {x, 0, 1.05 Pi, .1}]};
ListPlot[data, PlotRange -> {0, 0.5}, Joined -> True, PlotMarkers -> {Automatic, Medium}]
enter image description here

Now, even the same plot marker will be used for all data sets at the clipped boundaries, both top and bottom.

$\endgroup$
3
  • 1
    $\begingroup$ I think this behavior should be considered as a bug: the combination of Joined -> True with PlotMarkers -> Automatic and default values for ClippingStyle and PlotRangePadding produces spurious plot markers at the edges of plot. Here is better example: ListPlot[Table[{x, Sin[x]}, {x, 0, 1.05 Pi, .1}], PlotRange -> {0, 0.5}, Joined -> True, PlotMarkers -> Automatic]. $\endgroup$ Commented Feb 5, 2014 at 2:37
  • $\begingroup$ @Alexey Popkov, I agree, already reported. $\endgroup$
    – saturasl
    Commented Feb 5, 2014 at 4:24
  • $\begingroup$ This bug is still present in version 10.0.0. $\endgroup$
    – Mr.Wizard
    Commented Jul 31, 2014 at 18:00

2 Answers 2

25
$\begingroup$
ListPlot[Table[Sin[x], {x, 0, Pi, .1}], PlotRange -> {0, 0.5}, Joined ->
True, PlotMarkers -> Automatic, ClippingStyle -> False, Frame -> True]
$\endgroup$
7
  • 3
    $\begingroup$ I just guessed this $\endgroup$
    – Coolwater
    Commented Feb 4, 2014 at 20:41
  • 3
    $\begingroup$ @Coolwater, good guess, thanks! None vs False, I remember there are similar cases, but can't exactly recall them for now. $\endgroup$
    – saturasl
    Commented Feb 4, 2014 at 21:08
  • 2
    $\begingroup$ PlotRangePadding -> None works too. It's documented, but not on the list of options in ListPlot-documentation, so you need to evaluate "ListPlot//Options" to find it $\endgroup$
    – Coolwater
    Commented Feb 4, 2014 at 21:12
  • 3
    $\begingroup$ FYI: ClippingStyle -> None does not work in v7, but False does. $\endgroup$
    – Mr.Wizard
    Commented Feb 5, 2014 at 12:05
  • $\begingroup$ X is varied from 0 to Pi i.e 3.14 but in the plot 30.4, why it is so can anybody tell me? $\endgroup$
    – Udichi
    Commented Oct 30, 2016 at 15:22
3
$\begingroup$

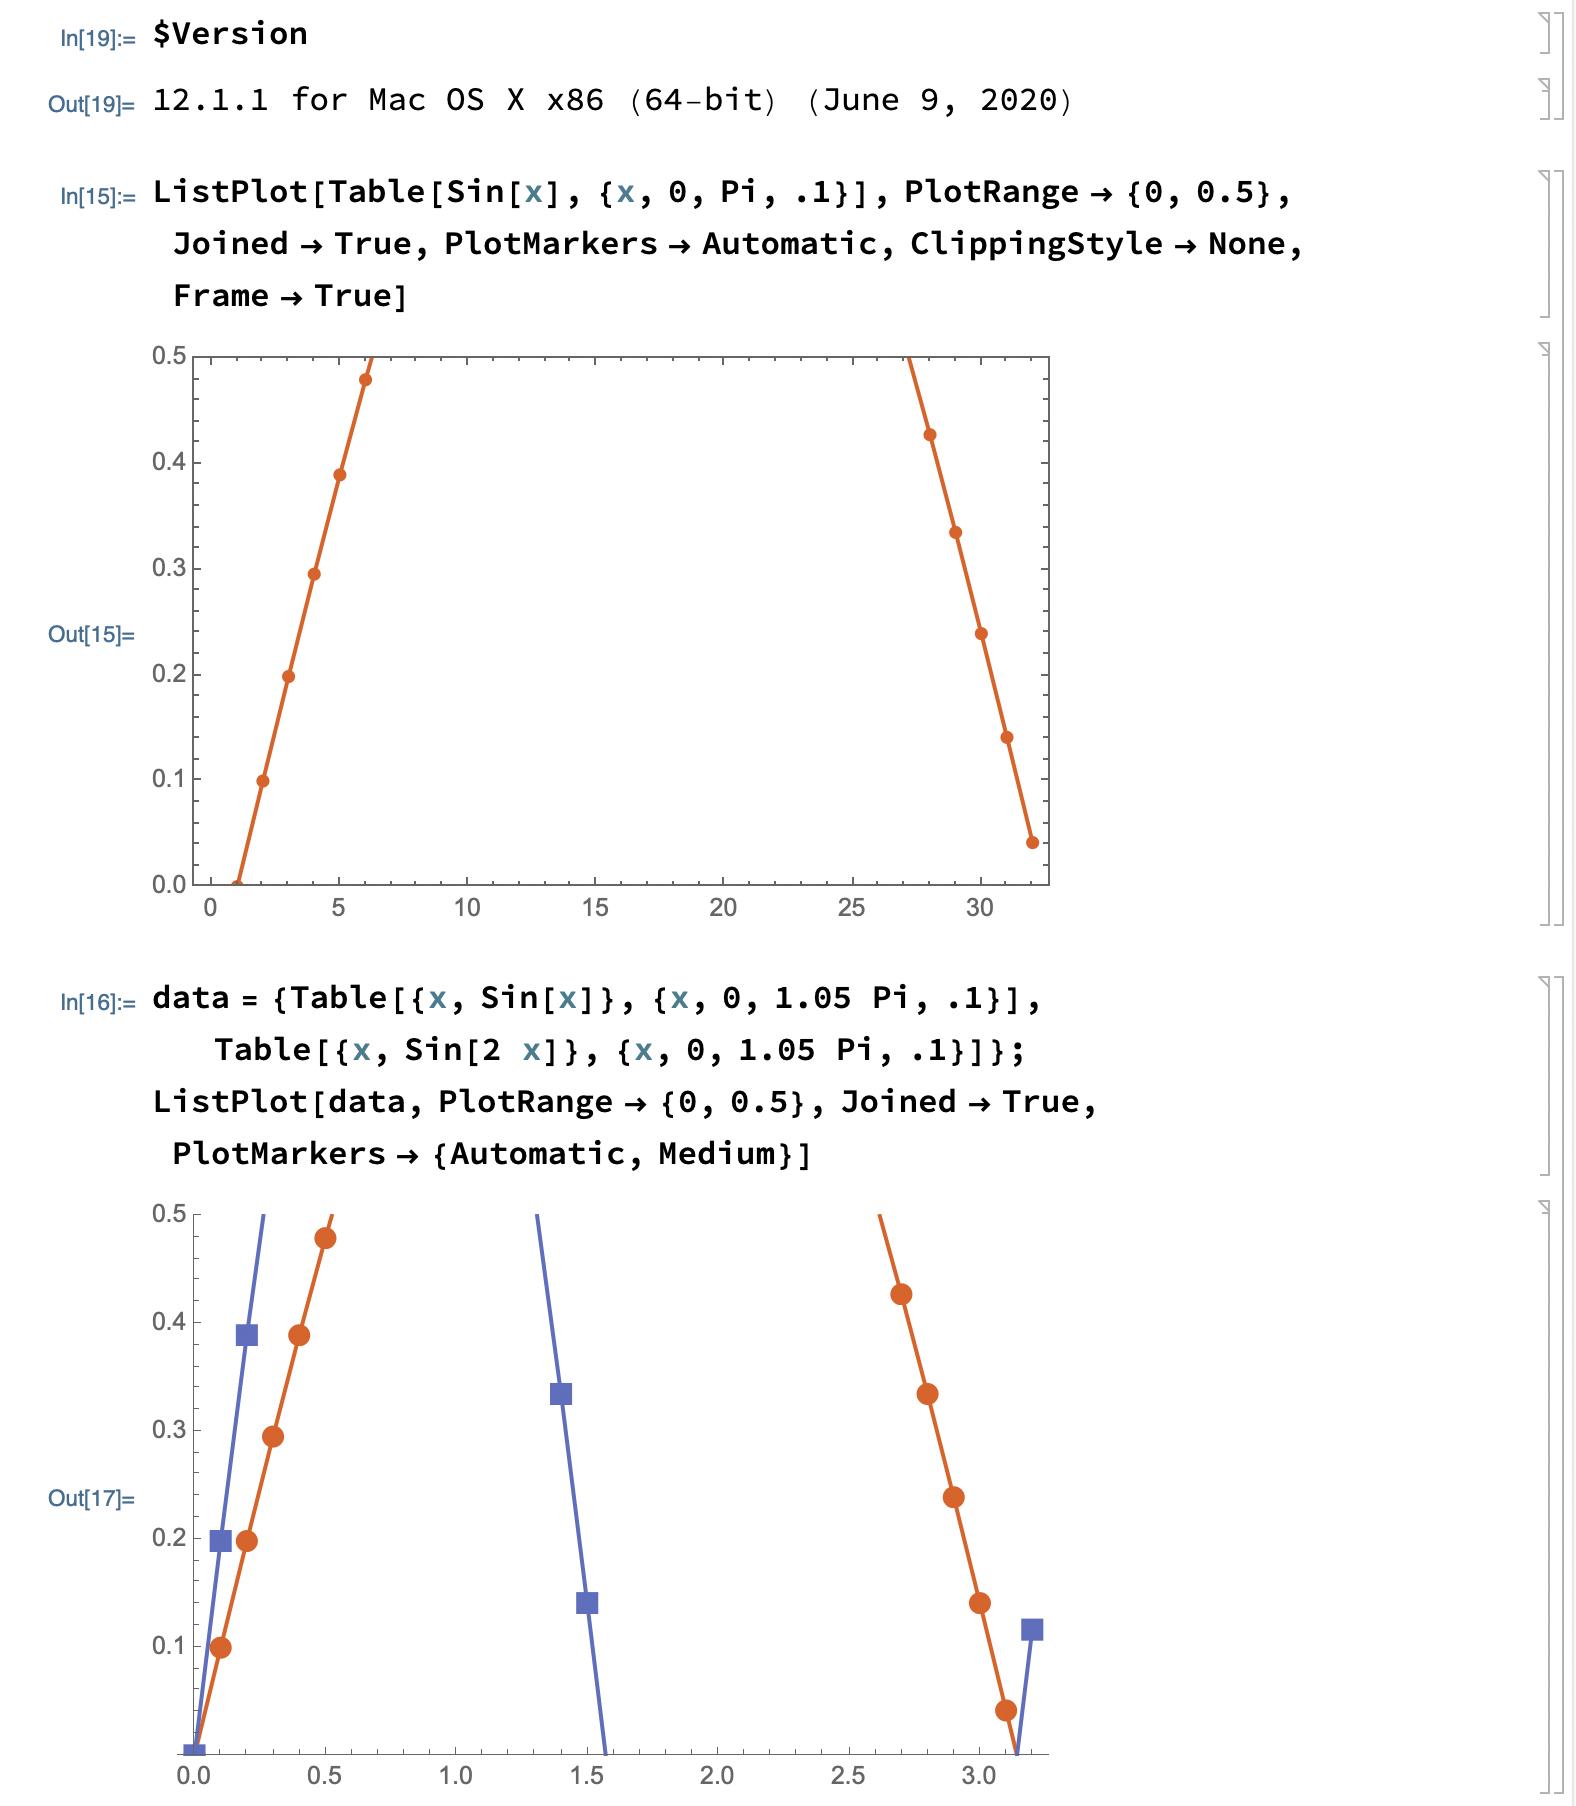
This seems to be fixed in 12.1.1 (at the latest):

screenshot of notebook

$\endgroup$

Your Answer

By clicking “Post Your Answer”, you agree to our terms of service and acknowledge you have read our privacy policy.

Not the answer you're looking for? Browse other questions tagged or ask your own question.