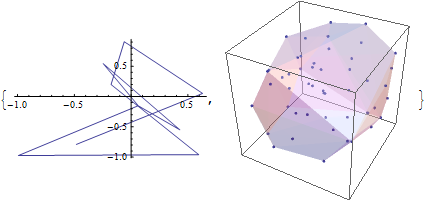
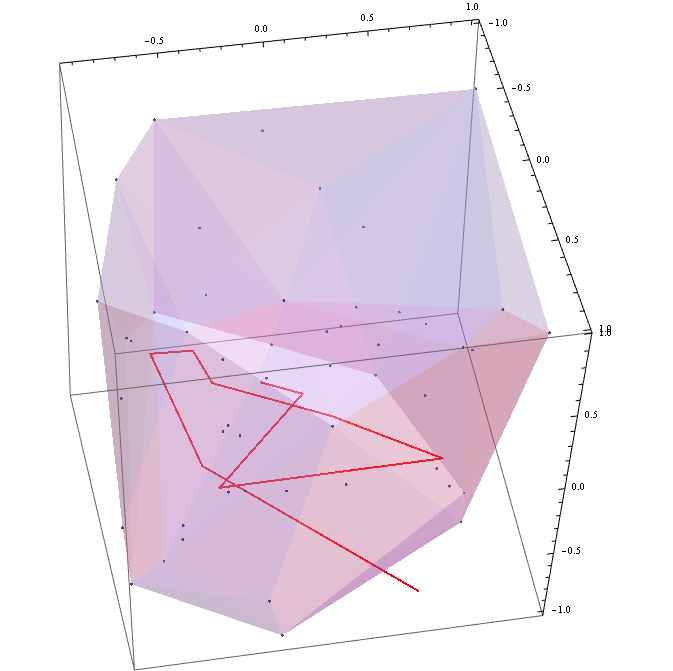
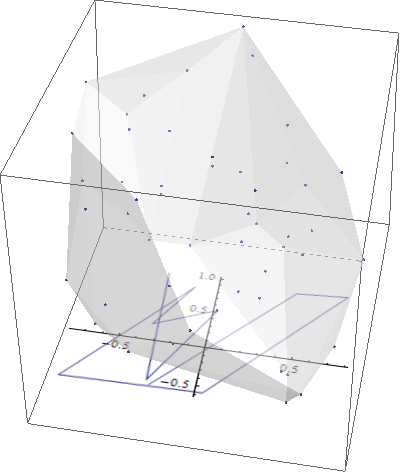
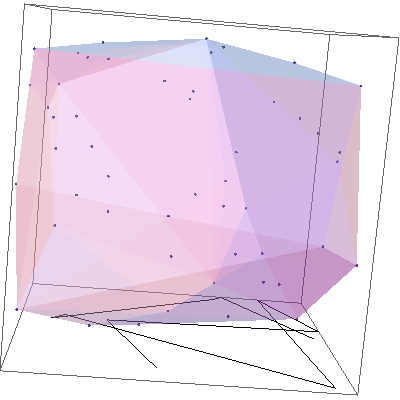
I have a ListlinePlot function, that I would like to combine with both a Graphics3D plot and a ListPointPlot3D plot, in such a way that the ListLinePlot is the bottom of the 3D boundary cube for the 3D plots. Can this be done in Mathematica 8.0.4?
Obviously the code below fails to combine the plots in Show, but is there another way to accomplish this? Thanks!
    Needs["TetGenLink`"]
twodPts = RandomReal[{-1, 1}, {10, 2}];
threedPts = RandomReal[{-1, 1}, {50, 3}];
{pts, surface} = TetGenConvexHull[threedPts];

twoDptsPlot = ListLinePlot[twodPts, ImageSize -> {200, 200}];
threeDPtsPlot = ListPointPlot3D[threedPts, ImageSize -> {200, 200}];
surfacePlot =
  Graphics3D[{EdgeForm[], Opacity[0.3],
    GraphicsComplex[pts, Polygon[surface]], ImageSize -> {200, 200}}];

{twoDptsPlot,
 Show[threeDPtsPlot, surfacePlot, ImageSize -> {200, 200},
  BoxRatios -> 1, Axes -> False]}

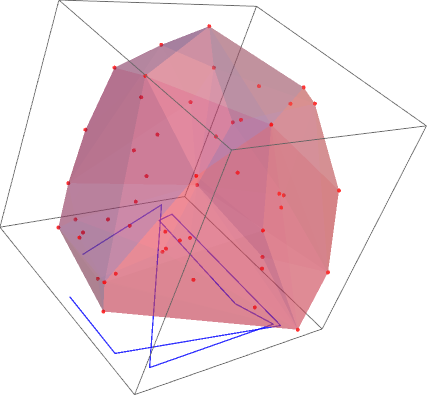
Showline. $\endgroup$Texturea plane with the 2D plot. $\endgroup$