I'd like to draw
Plot[Re@Sin[x+I*2], {x, -10, 10}]
as an epilog on
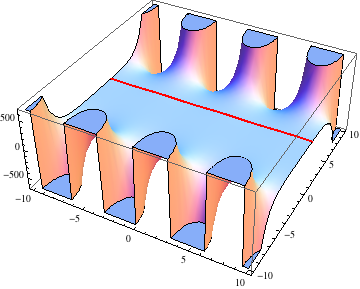
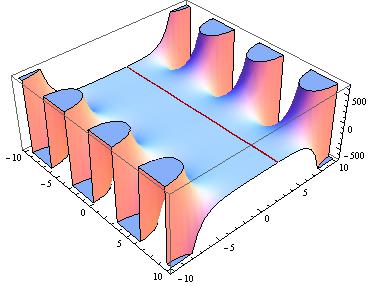
Plot3D[Re@Sin[x + I*y], {x, -10, 10}, {y, -10, 10}]
and position it at y=2.
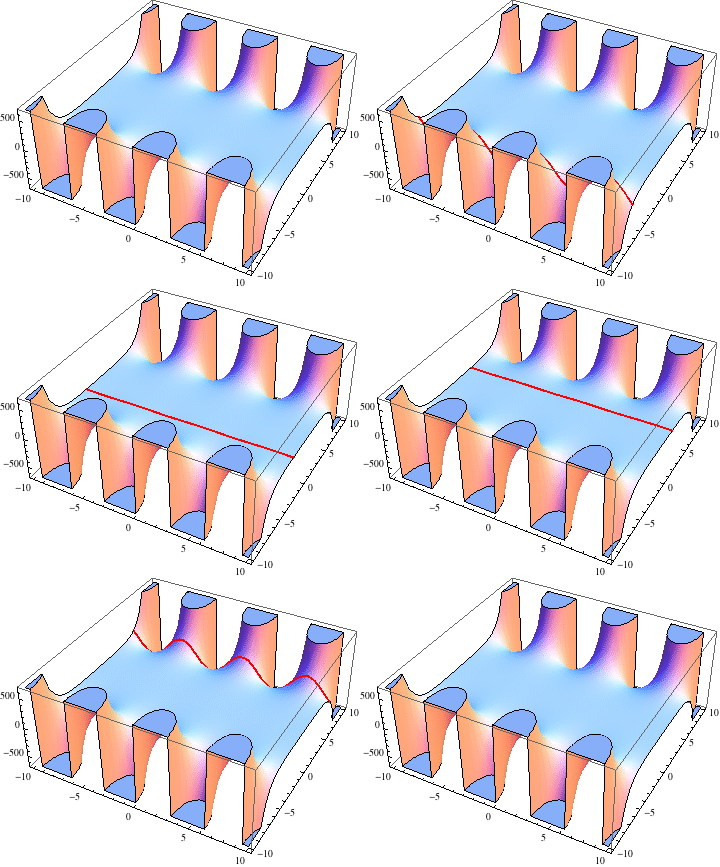
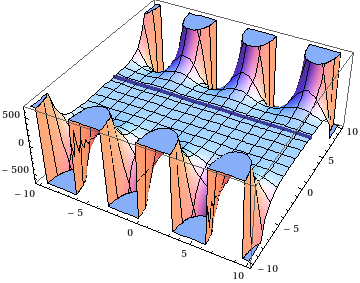
What's intuitive to me doesn't work:
epilogData = Table[{x, 2, Re@Sin[x + 2*I]}, {x, -10, 10, 0.1}];

Plot3D[Re@Sin[x + I*y], {x, -10, 10}, {y, -10, 10},
 Epilog -> {Red, PointSize[Large], Point[epilogData]}]
Using
epilogData2D = Table[{x, Re@Sin[x + 2*I]}, {x, -10, 10, 0.1}];
will draws something, but not what i want (What's that anyway?).
I've also played with Inset and got no luck so far.


