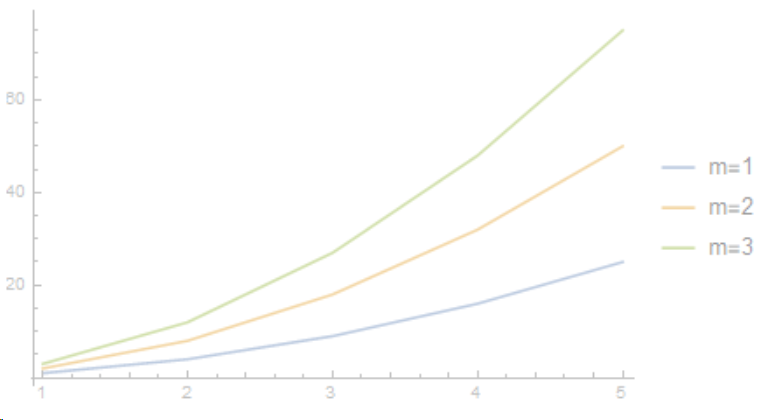
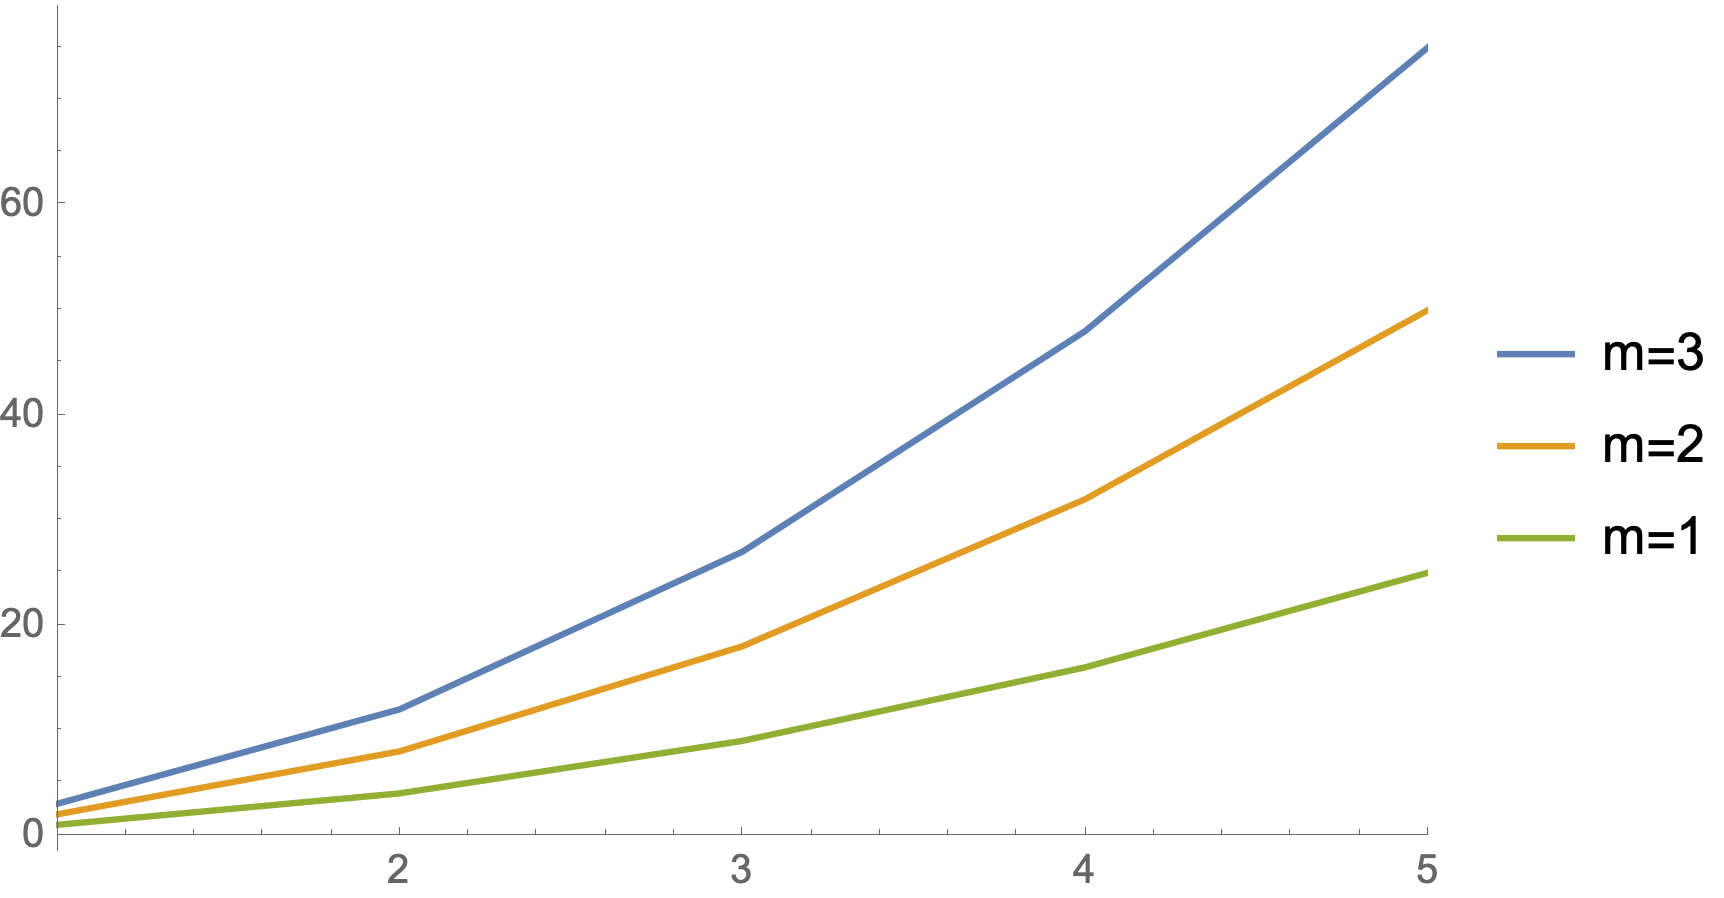
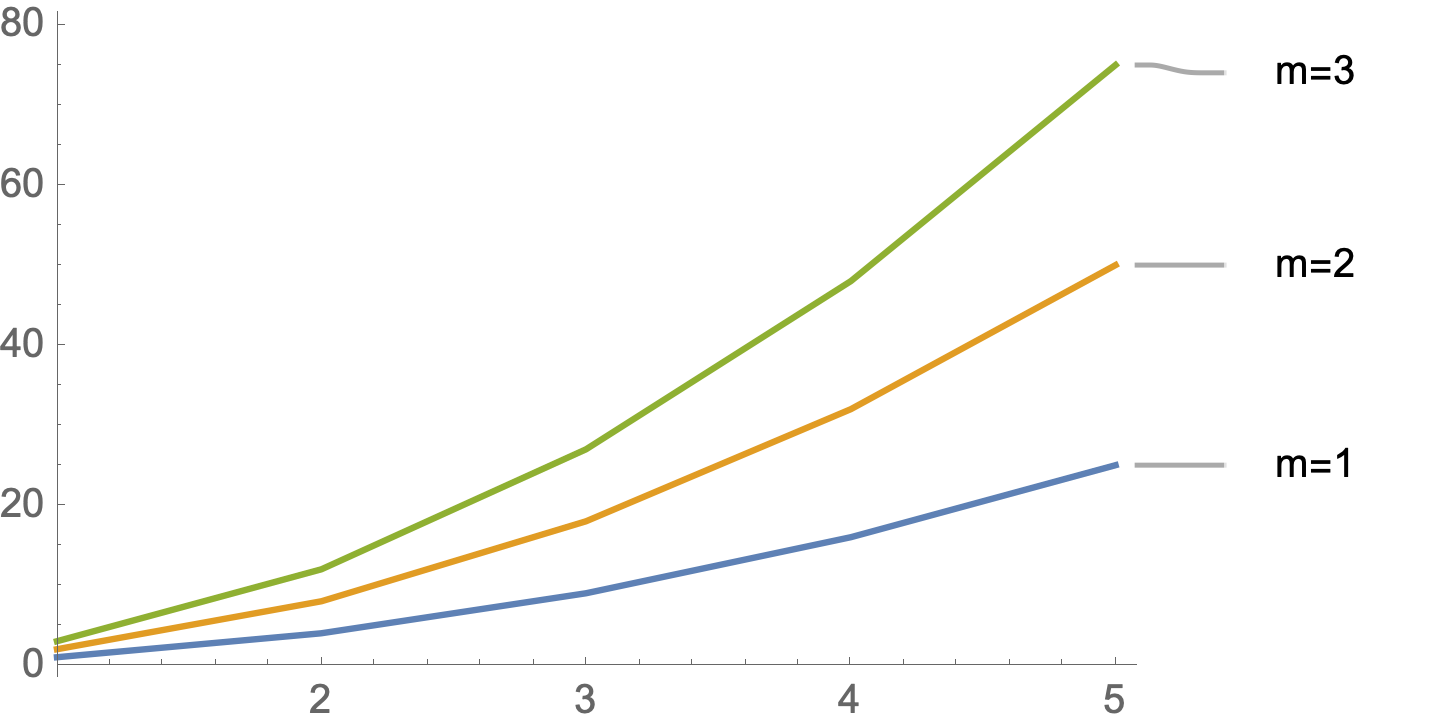
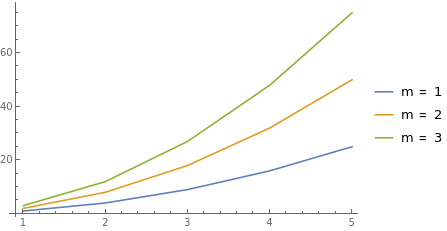
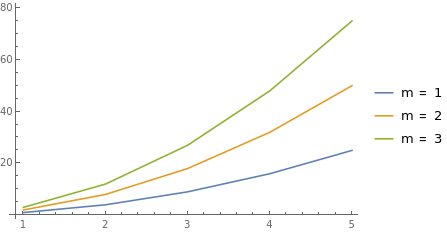
Is there a way I can sensibly automate the PlotLegends expressions within plot so as to correctly label each curve even when I change some of the initial parameter values? For example, consider the plot
a = 1;
b = 3;
c = 1;
ListPlot[Table[Table[{n, m n^2}, {n, 1, 5}], {m, a, b, c}],
 Joined -> True, PlotLegends -> {"m=1", "m=2", "m=3"}]
I've got the values in the PlotLegends expressions specific to the values of $a$, $b$ and $c$ I've used initially. Is there a way to generate a table (for example) for PlotLegends along the lines of
a = 1;
b = 3;
c = 1;
ListPlot[Table[Table[{n, m n^2}, {n, 1, 5}], {m, a, b, c}],
 Joined -> True, PlotLegends ->Table[{"a+(n-1)c"},{n,1,(b-a)/c+1}]]
This itself doesn't work but I'd imagine something similar might?
Thanks in advance for any help.

