given the following data organized by year
y2011 = {121.68, 70.82, 82.62, 111.03, 76.9, 76.51, 86.07, 70.03,
  72.14, 114.14, 135.51, 104.51}
y2012 = {97.19, 72.03, 116.25, 78.66, 89.94, 152.21, 70.03, 85.07,
  129.75, 87.94, 125.58, 157.15}
y2013 = {154.21, 106.78, 116.62, 70.03, 121.69, 110.52, 159.96, 71.66,
   70.03, 89.14, 0, 0}
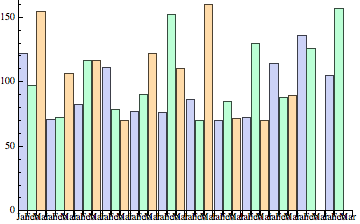
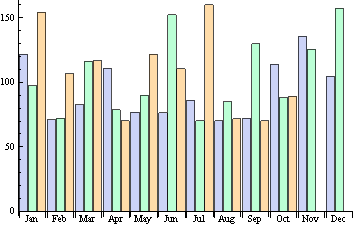
I want to draw the following diagram, grouping the data of the same months together:
BarChart[Transpose[{y2011, y2012, y2013}],
 ChartLabels -> {"Jan", "Feb", "Mar", "Apr", "May", "Jun", "Jul",
   "Aug", "Sep", "Oct", "Nov", "Dec"}]

How can I show just one ChartLabel per month/category?

