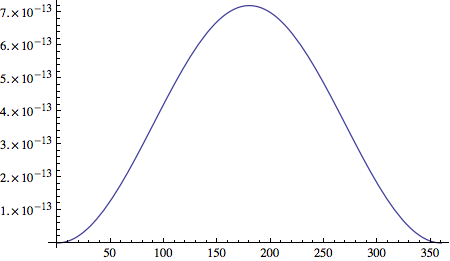
I'm trying to plot the Compton Shift which I've defined as:
E2[ϕ_] := E1/(1 + (E1/(m*c^2))*(1 - Cos[ϕ Degree]))
I've initiated the constants and when I evaluate the function for various degrees, it gives me the correct answer.
The issue I'm getting is that when I try and plot this function (with m = 1, c = 299792458 and E1 = 180), my plot shows a line until the value of ϕ is increased to above ~30-40. I'll get a flat line for small values of Phi but for larger values, the line disappears and I get a blank plot.
What is the reason for this? Am I doing something wrong?


E1 - E2[phi]if you want to see the change in E2. $\endgroup$