2
$\begingroup$

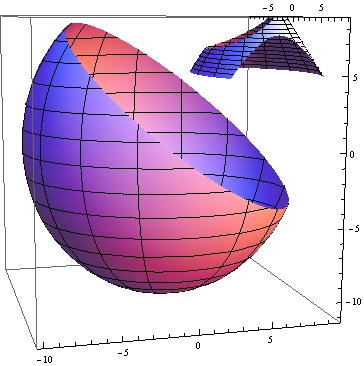
I know this is very similar to a previous question I asked, but there are some differences. When I graph:

 ParametricPlot3D[
 If[Part[RotationMatrix[-ArcCos[7/Sqrt[83]], {-5, 3, 0}] . {9*Cos[s]*
 Sin[(Pi/7) t], 10*Sin[s]*Sin[(Pi/7) t], 
 11*Cos[(Pi/7) t]}, 3] < 21/Sqrt[83], 
 RotationMatrix[-ArcCos[7/Sqrt[83]], {-5, 3, 0}] . {9*Cos[s]*
 Sin[(Pi/7) t], 10*Sin[s]*Sin[(Pi/7) t], 
 11*Cos[(Pi/7) t]}, {7*(Cos[s]) (7 - t)/7 + 5, 
 4*(Sin[s]) (7 - t)/7 + 5, t + 5}], {s, 0, 2 Pi}, {t, 0, (7/Pi)*Pi}]

I get:
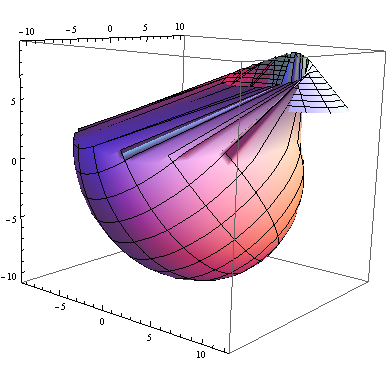
enter image description here

But I want to get a clean combination of:

  ParametricPlot3D[
  If[Part[RotationMatrix[-ArcCos[7/Sqrt[83]], {-5, 3, 0}] . {9*Cos[s]*
  Sin[(Pi/7) t], 10*Sin[s]*Sin[(Pi/7) t], 
  11*Cos[(Pi/7) t]}, 3] < 21/Sqrt[83], 
  RotationMatrix[-ArcCos[7/Sqrt[83]], {-5, 3, 0}] . {9*Cos[s]*
  Sin[(Pi/7) t], 10*Sin[s]*Sin[(Pi/7) t], 
  11*Cos[(Pi/7) t]}], {s, 0, 2 Pi}, {t, 0, (7/Pi)*Pi}]
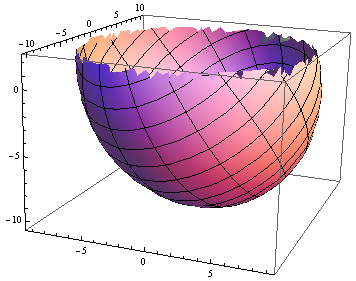
enter image description here (this picture should not have a scratchy top, I don't why it does, please help) and:

ParametricPlot3D[{7*(Cos[s]) (7 - t)/7 + 5, 4*(Sin[s]) (7 - t)/7 + 5, 
t + 5}, {s, 0, 2 Pi}, {t, 0, (7/Pi)*Pi}]
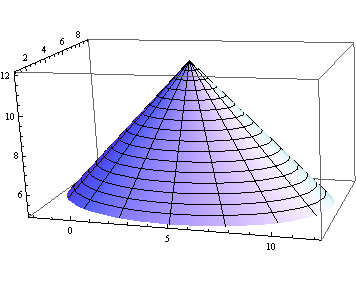
enter image description here

When I say combination, I want to be able to have an equation that represents the combination of both graphs which is able to manipulated (rotated, shifted,etc...). If I combine them using Show[] this is quite difficult, because Show[], is not an actual math equation that is manipulable. I especially want to be able to apply RotationMatrix[] to the resulting combination equation.

Please help. Thank You.

$\endgroup$

1 Answer 1

5
$\begingroup$

There is a very good reason for Mathematica to display a weird plot: your surfaces aren't connected:

r[s_, t_] := 
  Part[RotationMatrix[-ArcCos[7/Sqrt[83]], {-5, 3, 0}].{9*Cos[s]*
      Sin[(Pi/7) t], 10*Sin[s]*Sin[(Pi/7) t], 11*Cos[(Pi/7) t]}, 3];

Show[
 ParametricPlot3D[{9*Cos[s]*Sin[(Pi/7) t], 10*Sin[s]*Sin[(Pi/7) t], 11*Cos[(Pi/7) t]}, 
                   {s, 0, 2 Pi}, {t, 0, (7/Pi)*Pi},
                   RegionFunction -> Function[{x, y, z, s, t}, r[s, t] < 21/Sqrt[83]]],
  ParametricPlot3D[{7*(Cos[s]) (7 - t)/7 + 5, 4*(Sin[s]) (7 - t)/7 + 5, t + 5},
                   {s, 0, 2 Pi}, {t, 0, (7/Pi)*Pi},
                   RegionFunction -> Function[{x, y, z, s, t}, r[s, t] > 21/Sqrt[83]]]]

Mathematica graphics

You should work out the math.

$\endgroup$
7
  • $\begingroup$ Why does the fact that my surfaces are disconnected, make it weird for Mathematica to graph? $\endgroup$
    – user9197
    Commented Sep 16, 2013 at 5:04
  • $\begingroup$ @user9197 Because Mma tries to connect them ... $\endgroup$ Commented Sep 16, 2013 at 5:07
  • $\begingroup$ Oh. Is there anyway to not use Show[] and implicitly graph the two surfaces without having Mathematica connected them? $\endgroup$
    – user9197
    Commented Sep 16, 2013 at 5:08
  • $\begingroup$ @user9197 Yes, but ... why don't you want to use Show[]? It is the natural way ... $\endgroup$ Commented Sep 16, 2013 at 5:11
  • 1
    $\begingroup$ @user9197 No need to complicate the question. Rotate[#, Pi, {1, 0, 0}] &@First@show // Graphics3D. Where show = Show[g1,g2] $\endgroup$
    – Kuba
    Commented Sep 16, 2013 at 6:00

Your Answer

By clicking “Post Your Answer”, you agree to our terms of service and acknowledge you have read our privacy policy.

Not the answer you're looking for? Browse other questions tagged or ask your own question.