Here's my code for what I'm working on:
ode = l1*(1 + 2*β^2 + 3*β*Cos[θ])*f[θ] + (1/2)*l2*(1 + 3*β*Cos[θ] + 2*β^2*Cos[2*θ])*Sin[2*θ]*Derivative[1][f][θ] +
     l2*(1 + β^2 + 3*β*Cos[θ] + β^2*Cos[2*θ])*Sin[θ]^2*Derivative[2][f][θ] == 0;

ics1 = {f[θ0] == 0, Derivative[1][f][θ0] == 1};

Block[
{l1 = 100, l2 = 1, β = 0.5, f0 = 1, fp0 = 1, θ0 = 2},
  eqn0 = ode;
Show[
{
ListLinePlot[NDSolveValue[{eqn0, ics1}, f, {θ, 0, Re[ArcCos[-β^(-1)]]}],
      PlotRange -> {{0, Re[ArcCos[-β^(-1)]]}, {-5, 5}}],

Graphics[{Red, Dashed, Line[{{Re[ArcCos[-β^(-1)]], -15}, {Re[ArcCos[-β^(-1)]], 15}}]},
      PlotRange -> {{-0.5, 1 + 0.2}, Automatic}], Graphics[{Orange, Dashed, Line[{{2, -15}, {2, 15}}]},
      PlotRange -> {{-0.5, 1 + 0.2}, Automatic}]
}
]
]
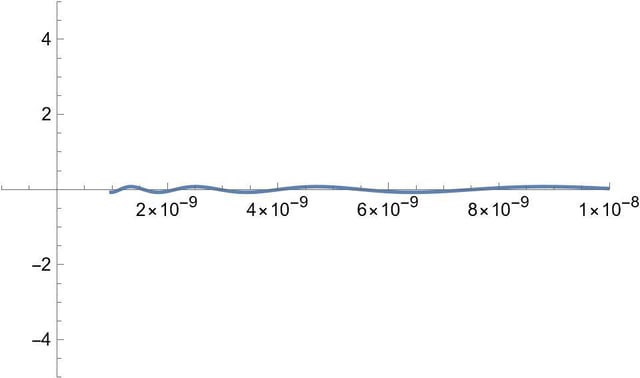
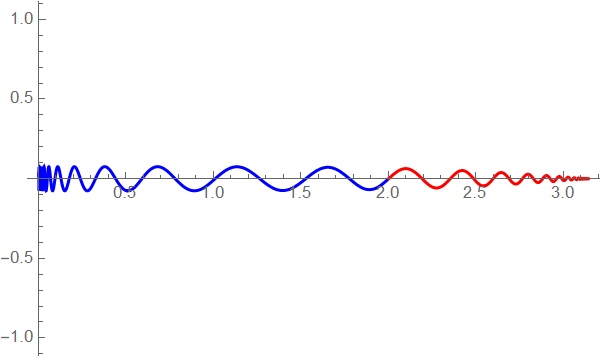
Essentially, l1 and l2 are parameters that define an infinite set of solutions. It may be insightful to play with them to see how the endpoints of the solution change. I've found that they appear bounded for β = 0.5 and a large l1 compared to l2. When I zoom in on my plot, at extremely small values of theta near zero, such as 10^-9, the solution isn't plotted exactly all the way to zero.
Here's a picture of l1 = 100, l2 = 1, and beta = 0.5 zoomed in to the range (10^-9,10^-8):
Looking at other choices of l1, l2, and beta, you'll find that the solution isn't bounded.


