You may have meant
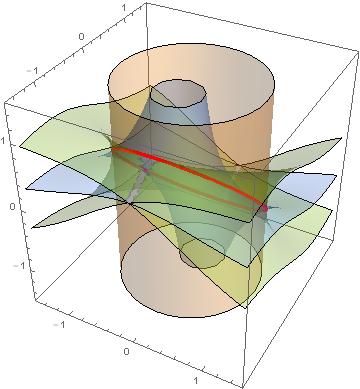
ContourPlot3D[{a^2 + b^2 == 1, a^2 c + (b (1 + b c)) == 0,
  a^2 c^2 + (1 + b c)^2 == a^2}, {a, -3/2, 3/2}, {b, -3/2, 3/2}, {c, -3/2, 3/2}]
which produces

Basically, I used the edit by David G. Stork, separated the three equations, and multiplied the second and third equations by a and a^2 respectively.
Addendum
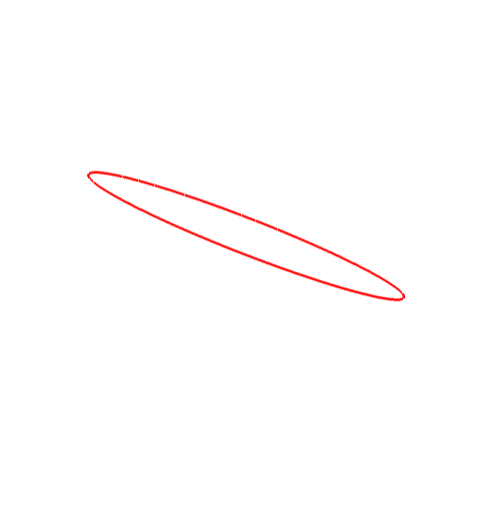
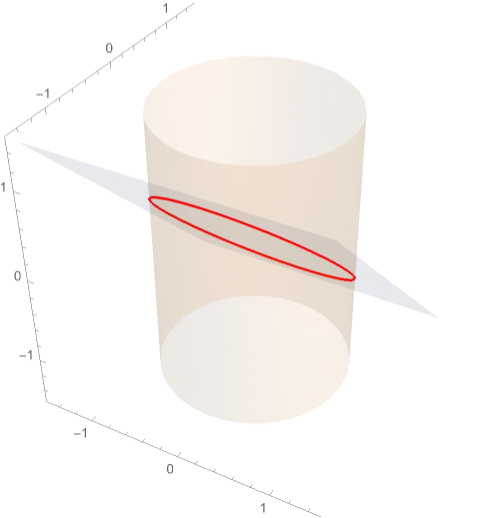
The intersection of the curves, as requested by the OP in a comment, can be displayed as follows:
r = ImplicitRegion[a^2 + b^2 == 1 && a^2 c + (b (1 + b c)) == 0, {a, b, c}];
ring = MeshRegion[DiscretizeRegion[r, {{-3/2, 3/2}, {-3/2, 3/2}, {-3/2, 3/2}}],
  MeshCellStyle -> {{1, All} -> Directive[Red, Thickness[.01]], {0, All} -> White}];
ctr = ContourPlot3D[{a^2 + b^2 == 1, a^2 c + (b (1 + b c)) == 0,
  a^2 c^2 + (1 + b c)^2 == a^2}, {a, -3/2, 3/2}, {b, -3/2, 3/2}, {c, -3/2, 3/2},
  ContourStyle -> Opacity[.3], Mesh -> None];
Show[{ctr, ring}]

Note that the same plot can be obtained from
Solve[{a^2 + b^2 == 1, a^2 c + (b (1 + b c)) == 0, a^2 c^2 + (1 + b c)^2 == a^2},
  {a, b, c}]
(* {{a -> -Sqrt[1 - c^2], b -> -c}, {a -> Sqrt[1 - c^2], b -> -c}} *)
Show[{ctr, ParametricPlot3D[{{Sqrt[1 - c^2], -c, c}, {-Sqrt[1 - c^2], -c, c}},
  {c, -3/2, 3/2}, PlotStyle -> Directive[Red, Thickness[.01]]]}]


ContourPlot3Dcan only handle a single scalar equality. $\endgroup$ContourPlot3Dappears to be able to handle multiple equations, although not in the form used in the Question. $\endgroup$ContourPlot3Dseemed to be fine with the form, though I'm not sure how it interpreted it. $\endgroup$(a^2+b^2-1)^2+()^2+()^2 ==0, however there does not appear to be any solution ( or only a single point , or very small region, so contourplot3d doesn't work ) $\endgroup$