0
$\begingroup$

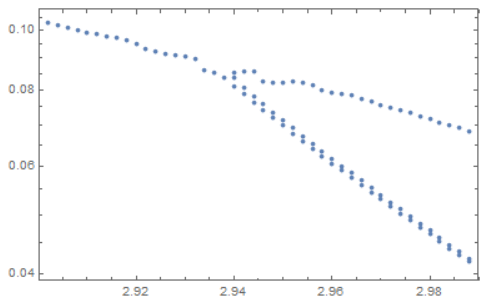
I have a list of data (3kB) in the form of {x,y}. For some x values, every x corresponds to a single y, for some others, every x corresponds to $3$ different y. Please see the following plot.

testpts = Import["~\\curves_test.dat"];
plt = ListLogPlot[testpts, PlotRange -> All, ImageSize -> 300, Frame -> True, Axes -> False]

enter image description here

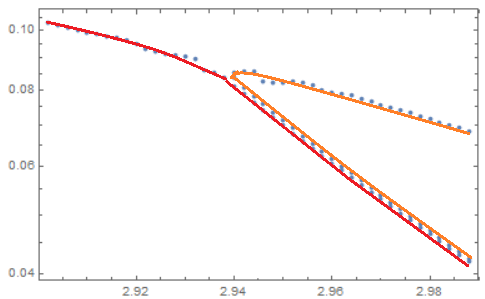
As you may see, there are actually two curves, one of which is folding (see the orange curve in the figure below). I would like to separate the data and interpolate them as two different smooth curves, such that I can plot them respectively. For example, this enables us to plot the two curves in different figures with Plot and LogPlot or with different PlotStyles, as illustrated in the desired results.

enter image description here

Notes

  1. The data are obtained from numerical calculation. The red and orange curves do not intersect (thanks to @JimB's advice). They look very close in a range (around 2.94<x<2.99) but actually well separated.

  2. Some parts of the data look not very smooth, thus I'd like to make them smooth somehow with appropriate interpolate functions.

  3. I need a general approach to handle lots of data with such kind of features, thus picking out data with Select[testpts, x1 < First@# < x2 && y1 <Last@# <y2 &] may not be very useful :)

Any suggestions are welcome!

$\endgroup$
2
  • $\begingroup$ Your two red curves are certainly plausible but I see 2 other plausible curves. (Others with more imagination than I have might likely see more possibilities.) Is there some additional information such as "curves don't intersect"? Maybe describing how the data was generated would help. Also your link gives message about a transfer being deleted (i.e., no data to download). $\endgroup$
    – JimB
    Commented Jun 4 at 5:18
  • $\begingroup$ @JimB there should be one red curve and one orange curve. I upload the data again via google drive. Please see also my update. $\endgroup$
    – user95273
    Commented Jun 4 at 7:33

2 Answers 2

0
$\begingroup$

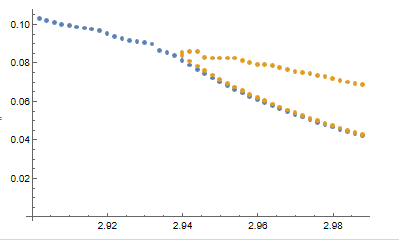
Assuming the data has been imported in the variable "d" and that the second curve is always above the first one. The curves are then:

d1 = Select[
   d, (tmp = Cases[d, {#[[1]], _}]; 
     If[Length[tmp] == 
        1 || (Length[tmp] > 1) && #[[2]] == Min[tmp[[All, 2]]], True, 
      False]) &];
d2 = Complement[d, d1];
ListPlot[{d1, d2}]

enter image description here

Next we need to smooth the curves. This is easy for d1:

d1s = Transpose[{d1[[All, 1]], LowpassFilter[d1[[All, 2]], 0.5]}];
ListPlot[d1s]

enter image description here

This is more difficult for d2 because the points are not in sequence. Therefore we need to reorder d2 before smoothing:

d2 = Complement[d, d1];
last = d2[[-1]];
d2l = Reap[
    Do[Sow[last = Nearest[d2 = DeleteCases[d2, last], last][[1]]], {i,
       2, Length[d2]}]
    ][[2, 1]] ;
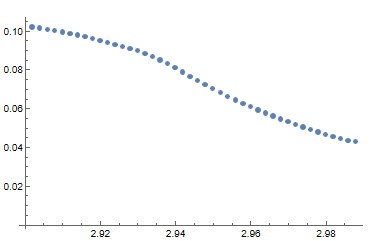
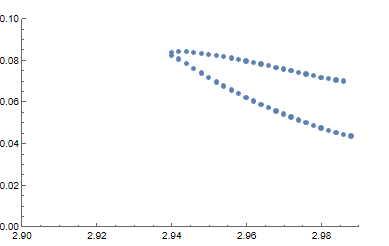
d2s = Transpose[{d2l[[All, 1]], LowpassFilter[d2l[[All, 2]], 0.5]}];
ListPlot[d2s, PlotRange -> {{2.9, 2.99}, {0, 0.1}}]

![enter image description here

$\endgroup$
1
  • $\begingroup$ As I mentioned, d2 is reordered to bring the points in order of the line. {2.988, 0.0685406} is the first point and {2.988, 0.0424755} is the last point $\endgroup$ Commented Jun 4 at 15:48
0
$\begingroup$

Not general, not elegant, but I think it solves your immediate problem.

(data is your data)

gg = GroupBy[data, First]

Pick out the minimum values if there are multiple points:

bottomCurve = Values[First /@ Sort /@ gg];

Remove those points from your data set:

topCurve = First[ data /. {Thread[bottomCurve -> Nothing]}]

A simple brute force method is to fit to a line and then separate the upper and lower branches by being above or below the line:

fit = FindFit[topCurve, a x + b, {a, b}, x]
linFit = (a x + b) /. fit

topBranch = Cases[topCurve, {a_, b_} /; (b >= linFit /. x :> a)]
botBranch = Cases[topCurve, {a_, b_} /; (b < linFit /. x :> a)]

Show[ListPlot[bottomCurve, PlotStyle -> Red], 
 ListPlot[topBranch, PlotStyle -> Blue], ListPlot[botBranch]]

If you want to stitch the two branches:

topJoinedCurve = Join[Reverse[topBranch], botBranch]
Show[ListPlot[bottomCurve, PlotStyle -> Red], 
 ListLinePlot[topJoinedCurve]]
$\endgroup$
4
  • $\begingroup$ Removing the bottom curve from data could be simplified as topCurve =data /. Thread[bottomCurve -> Nothing]? $\endgroup$
    – user95273
    Commented Jun 4 at 10:34
  • $\begingroup$ I think that will also work, I threw in an extra {}. Did you try your adjustment? I think you need the First though. Otherwise, it won't select the bottom branch. Intresting that @Daniel Huber took a very different approach. I generally like his solutions. $\endgroup$ Commented Jun 4 at 13:54
  • $\begingroup$ @Daniel Huber 's solution also smooths your data which is a bonus. I encourage you to accept one and or the other as an answer--if they serve your purposes. $\endgroup$ Commented Jun 4 at 14:49
  • $\begingroup$ I tried without First and it works as expected. So far, Daniel's solution solved most of the problems in the post. I still want to improve the solution and will wait one to two days before accepting an answer. $\endgroup$
    – user95273
    Commented Jun 4 at 15:47

Your Answer

By clicking “Post Your Answer”, you agree to our terms of service and acknowledge you have read our privacy policy.

Not the answer you're looking for? Browse other questions tagged or ask your own question.