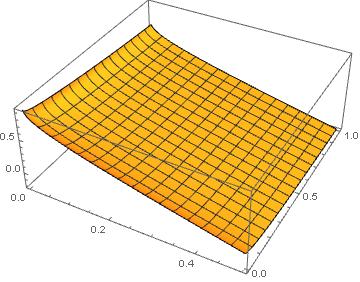
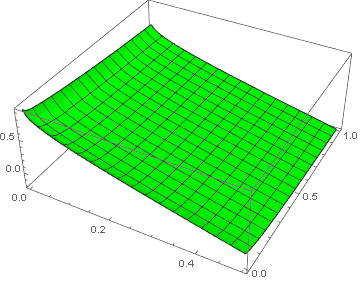
For this question, I cannot use random sample data. So the actual data can be found here. The data file contains three columns, where the first two are the coordinates $(x,y)$, while the third is the value of a function $f$. Now we plot them, thus obtaining the shape of $f$
data = Import["L1.dat", "Table"];
or
data = Import["https://pastebin.com/raw/YMCFB4mK", "TSV"]
Plot
L0 = ListPlot3D[data]
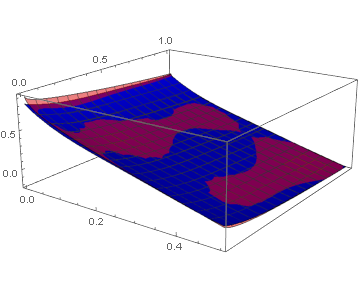
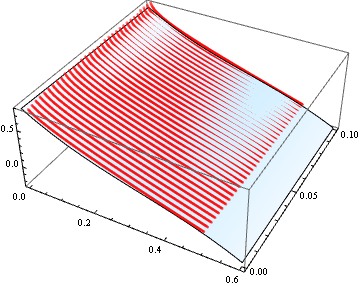
My question is the following: is there a way to interpolate the data and obtain an analytical fitting function $f(x,y)$? Taking into account that the distribution of $f$ is rather smooth, without peaks and holes, I suppose it should be rather easy to obtain its fitting function. Any ideas?


Interpolation? E.g.,iF = Interpolation[data];Plot3D[iF[x, y], {x, 0, .5}, {y, 0, 1}]? $\endgroup$Interpolationor fit. What is it? $\endgroup$