6
$\begingroup$

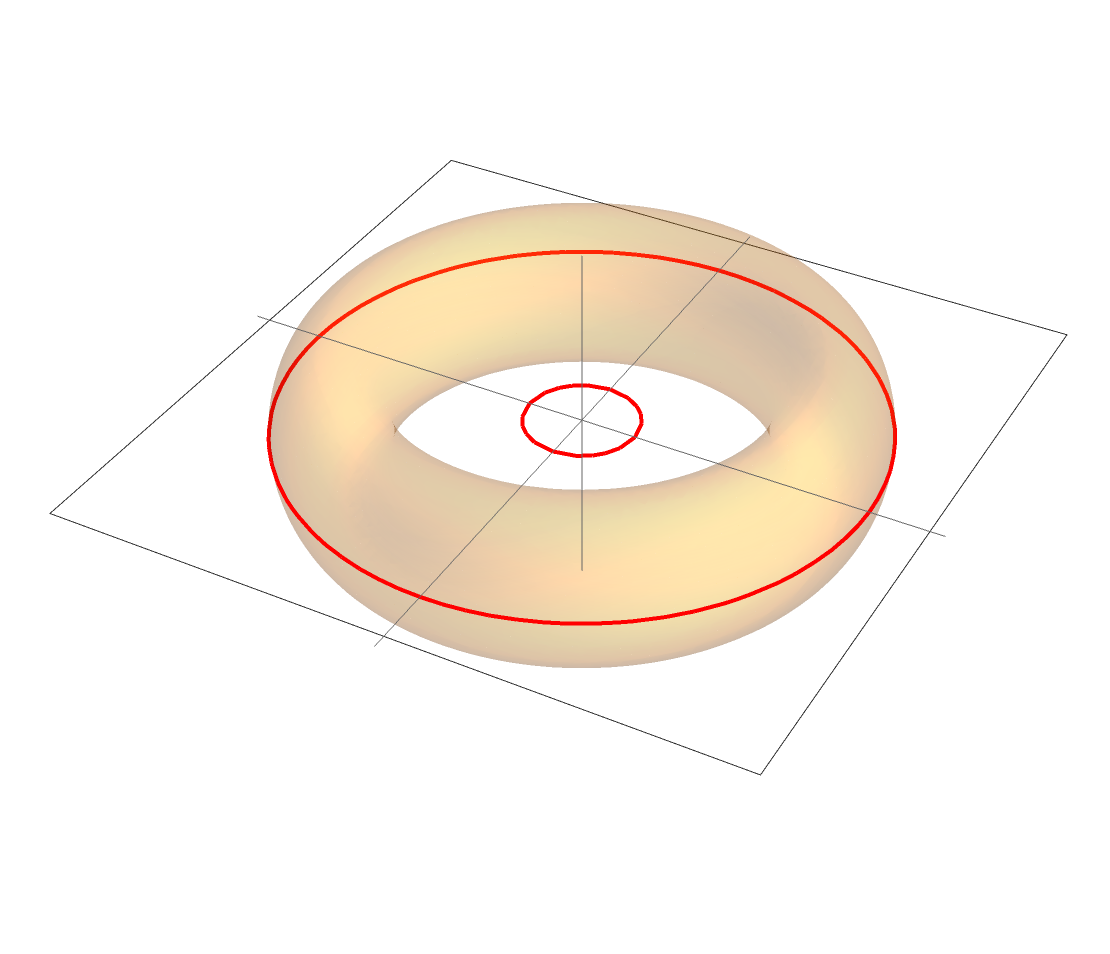
In the following graphic of a solid torus, how can I show in the plane z = 0 just the outer "equatorial circle", and not the smaller circle inside, without parameterizing that equatorial circle?

With[{R = 2, r = 0.5}, 
 Show[{RegionPlot3D[(R - Sqrt[x^2 + y^2])^2 + z^2 <= r^2, {x, -3, 
     3}, {y, -3, 3}, {z, -1, 1}, MaxRecursion -> 5, PlotPoints -> 60, 
    PlotStyle -> Opacity[0.2], Mesh -> None, AxesOrigin -> {0, 0, 0}, 
    Ticks -> None, Boxed -> False, BoxRatios -> {1, 1, 0.5}],
   SliceContourPlot3D[(R - Sqrt[x^2 + y^2]) + 
     r, {"ZStackedPlanes", {0}}, {x, -3, 3}, {y, -3, 3}, {z, -1, 1},
    Contours -> 1, ContourShading -> None,
    ContourStyle -> Directive[Thick, Red], AxesOrigin -> {0, 0, 0}, 
    Ticks -> None, Boxed -> False]}, ImageSize -> Scaled[0.7]]
 ]

Solid torus with equator and spurious circle

$\endgroup$
5
  • $\begingroup$ Don't use a contour plot, use this: ResourceFunction["Circle3D"] in a Graphics3D $\endgroup$
    – flinty
    Commented Mar 17 at 15:22
  • $\begingroup$ Add BoundaryStyle -> None, RegionFunction -> Function[{x, y, z, f}, Sqrt[x^2 + y^2] > r] into SliceContourPlot3D. $\endgroup$
    – cvgmt
    Commented Mar 17 at 15:25
  • $\begingroup$ Simple solution: Graphics3D[{{Opacity[0.5], Torus[{0, 0, 0}, {5, 10}]}, Black, Torus[{0, 0, 0}, {10, 10.2}]}]`` $\endgroup$ Commented Mar 17 at 17:28
  • $\begingroup$ Solution using RegionFunction is closest in spirit to my original. The ResourceFunction["Circle3D"] seems awkward in that default has circle in plane perpendicular to x-axis. The solution using Torus sort of defeats my purpose in actually using equation of the torus, and its equatorial circle becomes a tube. $\endgroup$
    – murray
    Commented Mar 17 at 19:21
  • $\begingroup$ How about plot /. {dir_, l1_Line, l2_Line} :> {dir, l1} to remove the offending line? $\endgroup$
    – Michael E2
    Commented Mar 17 at 20:00

1 Answer 1

6
$\begingroup$

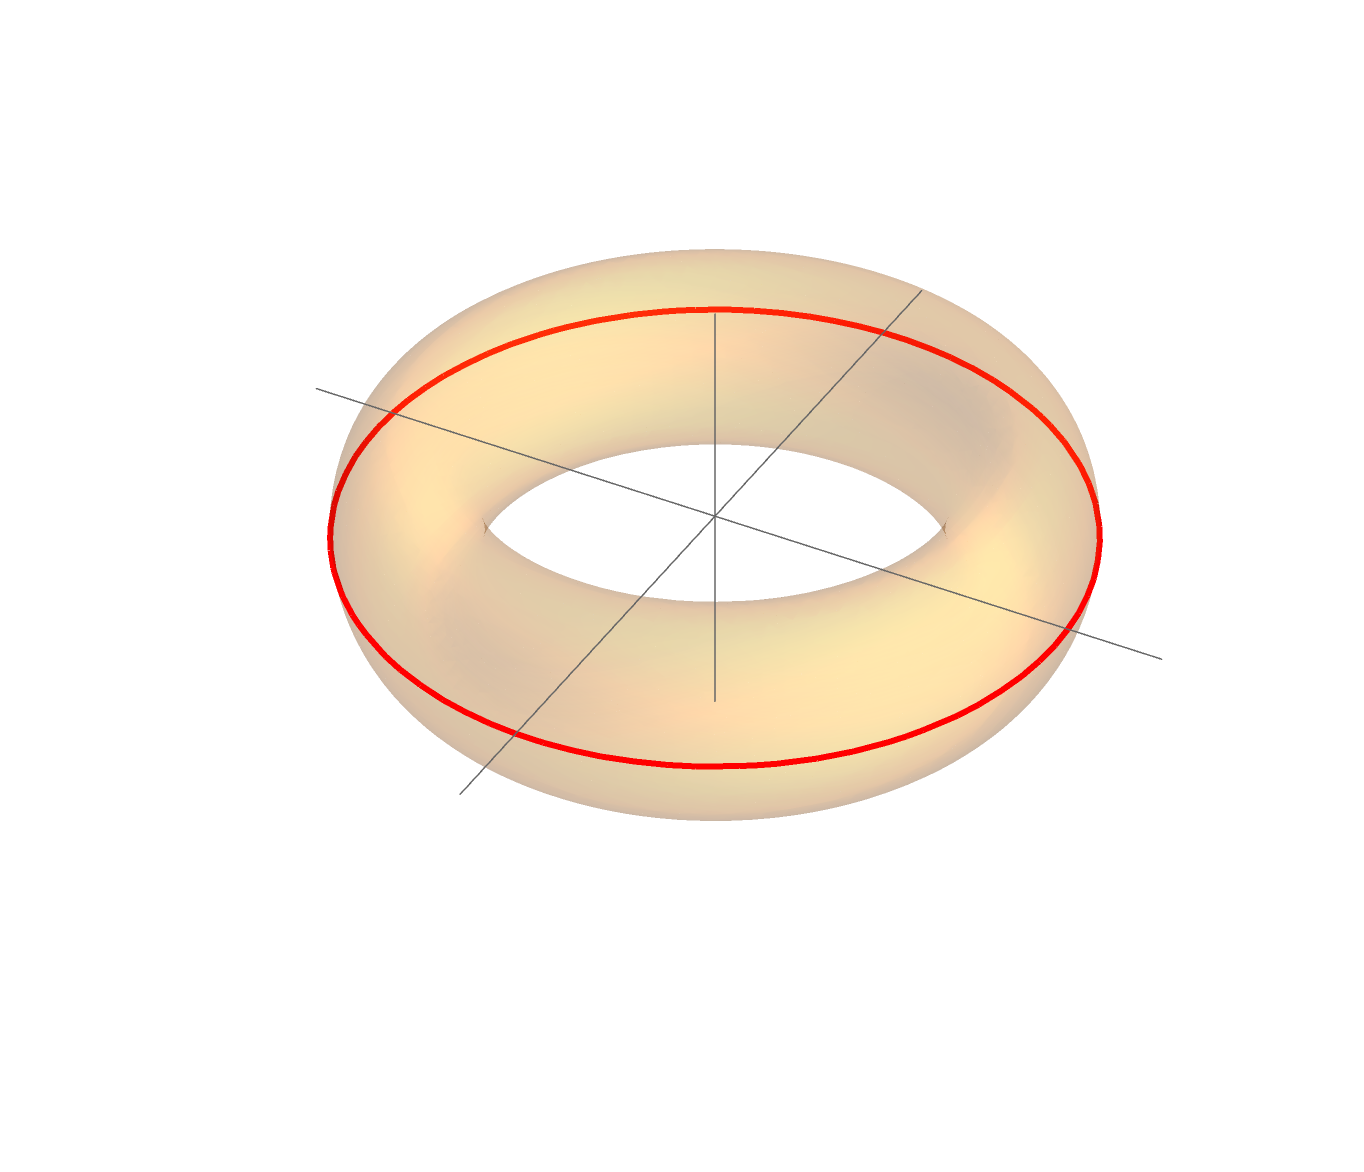
You can use RegionFunction and BoundaryStyle:

With[{R = 2, r = 0.5},
 Show[{
   RegionPlot3D[
    (R - Sqrt[x^2 + y^2])^2 + z^2 <= r^2
    , {x, -3, 3}, {y, -3, 3}, {z, -1, 1}
    , MaxRecursion -> 5, PlotPoints -> 60, PlotStyle -> Opacity[0.2], 
    Mesh -> None, AxesOrigin -> {0, 0, 0}, Ticks -> None, 
    Boxed -> False, BoxRatios -> {1, 1, 0.5}],
   SliceContourPlot3D[
    (R - Sqrt[x^2 + y^2]) + r
    , {"ZStackedPlanes", {0}}
    , {x, -3, 3}, {y, -3, 3}, {z, -1, 1}
    , Contours -> 1, ContourShading -> None, 
    ContourStyle -> Directive[Thick, Red], AxesOrigin -> {0, 0, 0}, 
    Ticks -> None, Boxed -> False, 
    RegionFunction -> Function[{x, y, z}, x^2 + y^2 > R^2], 
    BoundaryStyle -> None
    ]}
  , ImageSize -> Scaled[0.7]]]

enter image description here

$\endgroup$

Your Answer

By clicking “Post Your Answer”, you agree to our terms of service and acknowledge you have read our privacy policy.

Not the answer you're looking for? Browse other questions tagged or ask your own question.