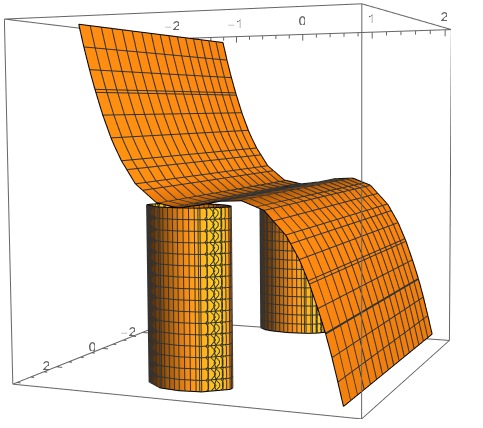
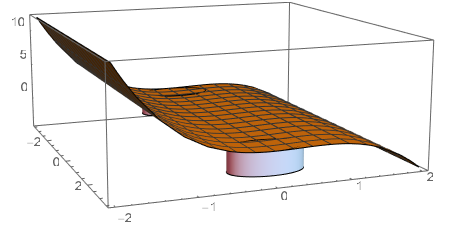
I am trying to graph the following surfaces so that they are all visible in the same place:
z == y^2 - y^3
on -3.5 < x < 3.5, -2 < y < 2, -3 < z < 3
(x-3)^2 + y^2 == 0.25
on -3.5 < x < 3.5, -2 < y < 2, -3 < z < 0
(x+3)^2 + y^2 == 0.25
on -3.5 < x < 3.5, -2 < y < 2, -3 < z < 0
How can I graph these three functions on these different intervals?


Show[ContourPlot3D[ z == y^2 - y^3, {x, -3.5, 3.5}, {y, -2, 2}, {z, -3, 3}], ContourPlot3D[{(x - 3)^2 + y^2 == 0.25, (x + 3)^2 + y^2 == 0.25}, {x, -3.5, 3.5}, {y, -2, 2}, {z, -3, 0}]]$\endgroup$