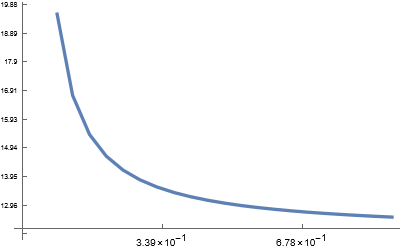
How can I control the number of decimal places the ticks show along the horizontal and vertical axes? I have tried various approaches but ListLinePlot seems to automate it.
     r=2;NN=10;y0=0.1;
sol = RecurrenceTable[{y[k + 1] == r*y[k]*(1 - y[k]), y[0] == y0}, y, {k, 0, NN}]; AA = ListLinePlot[sol, Mesh -> All, AxesOrigin -> {-1, 0},  DataRange -> {0, NN} ,
PlotStyle -> {{Thickness[0.0015], Blue}, PointSize[0.021]}];
BB = Plot[(r - 1)/r, {x, 0, NN}, PlotStyle -> {{Thickness[0.0025], Red}}];
Show[AA, BB, Ticks -> {Range[0, NN, 1], Range[0, 1, 0.05]}]

