5
$\begingroup$

The default output for the ANOVA function is that of a type 1 Sum of Squares (SS) table. This is sufficient for a one-way ANOVA, however, when running an n-way ANOVA (with n greater than 1) and allowing for interactions to be tested the "accepted" method seems to be either type 2 or 3 SS. I have been unable to locate a method allowing the output of the type 3 SS from the ANOVA function and have confirmed using XLSTAT that the output from the ANOVA function in Mathematica is a type 1 SS. I can of course make use of XLSTAT for such analyses but would like to use Mathematica for all data analysis if possible. Below is an example to showcase the effect of factor order on the type 1 SS for unbalanced data. The dataset shown below is copied from the ANOVA documentation page with the last entry removed to make the dataset unbalanced.

threewaydata = {{1, 1, 1, 50}, {1, 1, 1, 50}, {1, 1, 1, 54}, {1, 1, 2,
     40}, {1, 1, 2, 36}, {1, 1, 2, 40}, {1, 2, 1, 48}, {1, 2, 1, 
    48}, {1, 2, 1, 44}, {1, 2, 2, 14}, {1, 2, 2, 18}, {1, 2, 2, 
    14}, {2, 1, 1, 40}, {2, 1, 1, 36}, {2, 1, 1, 36}, {2, 1, 2, 
    18}, {2, 1, 2, 14}, {2, 1, 2, 18}, {2, 2, 1, 6}, {2, 2, 1, 2}, {2,
     2, 1, 2}, {2, 2, 2, 20}, {2, 2, 2, 16}};

The following code reorders the factors provided to the ANOVA function.

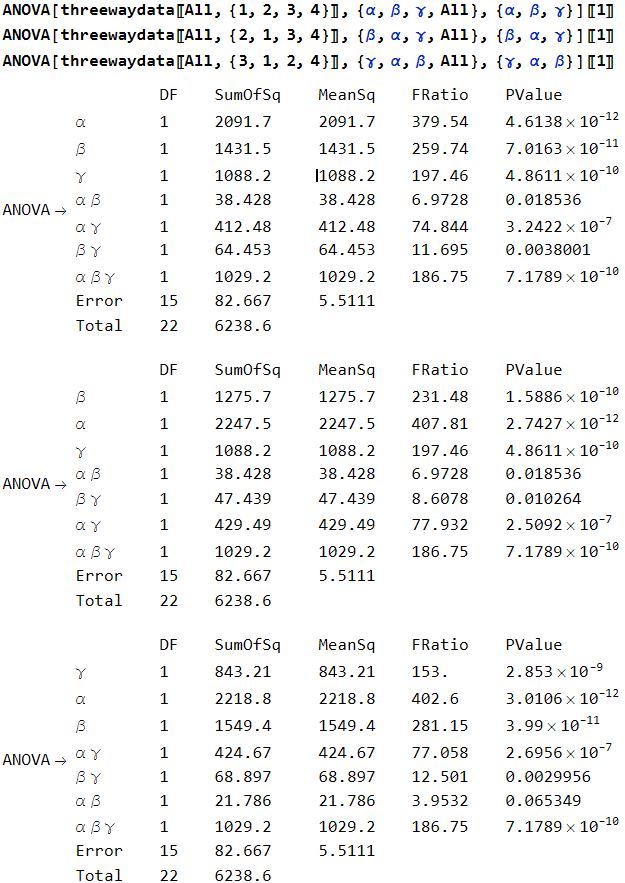
ANOVA[threewaydata[[All, {1, 2, 3, 4}]], {α, β, γ, All}, {α, β, γ}][[1]]
ANOVA[threewaydata[[All, {2, 1, 3, 4}]], {β, α, γ, All}, {β, α, γ}][[1]]
ANOVA[threewaydata[[All, {3, 1, 2, 4}]], {γ, α, β, All}, {γ, α, β}][[1]]

Below are the respective outputs. The p values for the factors and their interactions differ due to the order in which they are included (with the exception of the 3 way interaction as it is included last). This is not an issue when using a type 3 SS. For this reason I would like to know if the type 3 SS can be obtained either using the ANOVA function itself, or if there is another function capable of doing so.

Input and output cells for the ANOVA analyses with reordered factors

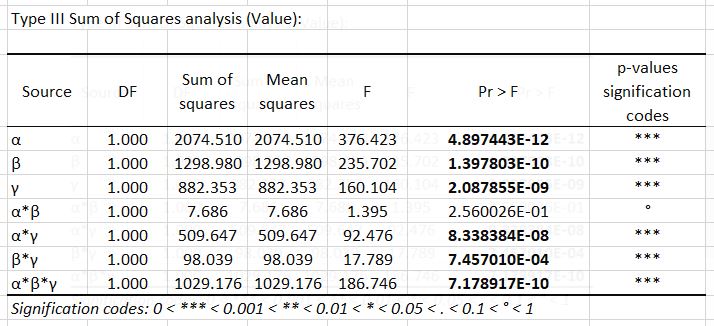
The type 3 SS obtained from XLSTAT is shown below (this is the desired output). XLSTAT output Below is the same analysis performed in Graphpad Prism. It appears to be an equivalent result to that of XLSTAT (with the factors in a different order and with less precision shown for the p-values) GraphpadPrism output
$\endgroup$
7
  • 1
    $\begingroup$ Welcome to the community. FittedModel (produced by LinearModelFit) have a property called "SequentialSumOfSquares", and "PartialSumOfSquares" which is what you're looking for (based on my limited knowledge, it doesn't support All, and other statistics should be calculated manually). $\endgroup$
    – Ben Izd
    Commented Jul 5, 2023 at 15:13
  • 2
    $\begingroup$ Because not all software uses the same definition of Type III SS, please give the results from XLSTAT or SAS or R that you want from the data and model you provided. As @BenIzd mentions LinearModelFit gives an option for obtaining PartialSumOfSquares which is what Type III SS are sometimes called. However, this doesn't match what SAS gives for Type III SS. $\endgroup$
    – JimB
    Commented Jul 5, 2023 at 16:55
  • $\begingroup$ Thank you both for your responses. I have updated my question to include outputs from both XLSTAT and Graphpad Prism for the type 3 SS. I will look into LinearModelFit to see if the output is equivalent to that of XLSTAT. $\endgroup$
    – Joel
    Commented Jul 5, 2023 at 18:20
  • 1
    $\begingroup$ Thanks for adding that. For whatever it's worth, those values for XLSTAT and Graphpad Prism match what SAS gives. $\endgroup$
    – JimB
    Commented Jul 5, 2023 at 18:21
  • 1
    $\begingroup$ "I understand the definition of type 3 SS is universal." Not exactly. See arxiv.org/pdf/1804.00545.pdf. $\endgroup$
    – JimB
    Commented Jul 5, 2023 at 22:29

2 Answers 2

4
$\begingroup$

Here I'll just tackle the problem when the number of levels is just 2 for each of the categorical variables.

The PartialSumOfSquares property of LinearModelFit will provide the Type III sum of squares that R, SAS, XLSTAT, and GraphPad Prism but (so far) only when the categorical variables are coded in a specific way. And that way is Deviation Coding (see https://stats.oarc.ucla.edu/r/library/r-library-contrast-coding-systems-for-categorical-variables/#DEVIATION).

For this case that means recoding the 1's and 2's to 1's and -1's.

threewaydata = {{1, 1, 1, 50}, {1, 1, 1, 50}, {1, 1, 1, 54}, {1, 1, 2, 40}, 
  {1, 1, 2, 36}, {1, 1, 2, 40}, {1, 2, 1, 48}, {1, 2, 1, 48}, {1, 2, 1, 44},
  {1, 2, 2, 14}, {1, 2, 2, 18}, {1, 2, 2, 14}, {2, 1, 1, 40}, {2, 1, 1, 36},
  {2, 1, 1, 36}, {2, 1, 2, 18}, {2, 1, 2, 14}, {2, 1, 2, 18}, {2, 2, 1, 6},
  {2, 2, 1, 2}, {2, 2, 1, 2}, {2, 2, 2, 20}, {2, 2, 2, 16}};

(* Convert 2's to -1'2 *)
data = threewaydata;
data[[All, 1]] = -2 data[[All, 1]] + 3;
data[[All, 2]] = -2 data[[All, 2]] + 3;
data[[All, 3]] = -2 data[[All, 3]] + 3;
lmf = LinearModelFit[data, {α, β, γ, α β, α γ, β γ, α β γ}, {α, β, γ}]
(* Type I sums of squares - default *)
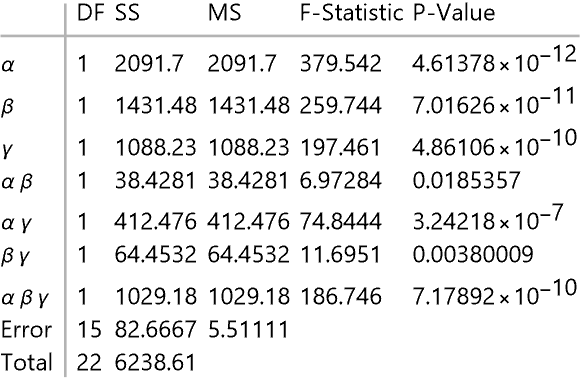
lmf["ANOVATable"]

Type I sums of squares

(* Type III sums of squares *)
lmf["PartialSumOfSquares"]
(* {2074.51, 1298.98, 882.353, 7.68627, 509.647, 98.0392, 1029.18} *)

These match with R, SAS, XLSTAT, and GraphPad Prism.

$\endgroup$
5
  • 3
    $\begingroup$ And an editorial: Mathematica is great but it has only a relatively primitive set of features for LinearModelFit. For example, there is no automatic way to select the type of sum of squares (I, II, III, or IV), as there is only a single error term allowed (i.e., mixed models are not implemented), and no nice way to produce contrasts or linear combinations of parameters. All of those features can be programmed with Mathematica commands but that limits the number of folks able to do that correctly - even for those who know the statistical background. $\endgroup$
    – JimB
    Commented Jul 6, 2023 at 5:22
  • $\begingroup$ Thank you very much for your answer, I have marked it as the solution. $\endgroup$
    – Joel
    Commented Jul 6, 2023 at 7:19
  • $\begingroup$ Very instructive. Are you writing Mathematica code for mixed models etc? +1 :) of course $\endgroup$
    – ubpdqn
    Commented Jul 6, 2023 at 12:11
  • $\begingroup$ @ubpdqn. No way! That functionality is far superior in R and SAS. $\endgroup$
    – JimB
    Commented Jul 6, 2023 at 12:26
  • $\begingroup$ @JimB agree different tools for different purposes. My R is rudimentary and rusty and I haven’t used RLink. Look forward to continuing to learn from answers…and thank you for supportive comment on meta post. $\endgroup$
    – ubpdqn
    Commented Jul 6, 2023 at 12:36
3
$\begingroup$

The documentation page ANOVA/tutorial/ANOVA gives the following example:

<<ANOVA`

threewaydata = {{1, 1, 1, 50}, {1, 1, 1, 50}, {1, 1, 1, 54}, {1, 1, 2,
     40}, {1, 1, 2, 36}, {1, 1, 2, 40}, {1, 2, 1, 48}, {1, 2, 1, 
    48}, {1, 2, 1, 44}, {1, 2, 2, 14}, {1, 2, 2, 18}, {1, 2, 2, 
    14}, {2, 1, 1, 40}, {2, 1, 1, 36}, {2, 1, 1, 36}, {2, 1, 2, 
    18}, {2, 1, 2, 14}, {2, 1, 2, 18}, {2, 2, 1, 6}, {2, 2, 1, 2}, {2,
     2, 1, 2}, {2, 2, 2, 20}, {2, 2, 2, 16}, {2, 2, 2, 20}};

ANOVA[threewaydata, {α, β, γ, α β, α γ, β γ}, {α, β, γ}]

and so it seems that all interactions could be determined with addition of a three-way product:

ANOVA[threewaydata, {α, β, γ, α β, α γ, β γ, α β γ}, {α, β, γ}]

This tutorial demonstrates a lot of options which can be employed to get you to the specific formula that you need.

$\endgroup$
1
  • $\begingroup$ Thank you very much for your response. I had previously looked into the documentation package you linked in your answer. My query focuses on the following statement quoted from the documentation: " All results are given as type I sums of squares". This means the order of the factors will affect the resulting p-values (with the exception of the final factor/interactions being added). For this reason type 3 SS is generally used, as it is not sequential: the order of the factors does change the resulting statistic or p-value. I will edit my question to better showcase this. $\endgroup$
    – Joel
    Commented Jul 5, 2023 at 12:18

Your Answer

By clicking “Post Your Answer”, you agree to our terms of service and acknowledge you have read our privacy policy.

Not the answer you're looking for? Browse other questions tagged or ask your own question.