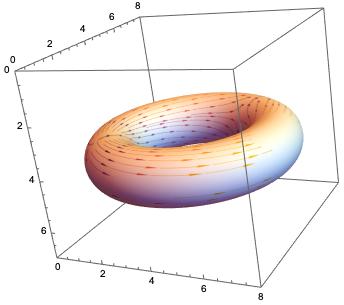
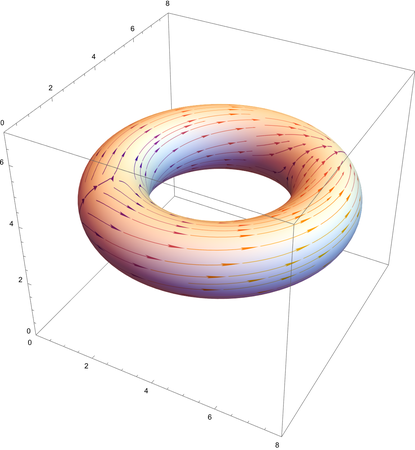
I am trying to plot a vector field over a torus. Here is my code and the image it produces:
f[x_, y_, z_] = x^2 + y^2 + z^2;
x[u_, v_] = 4 + (3 + Cos[v]) Sin[u];
y[u_, v_] = 4 + (3 + Cos[v]) Cos[u];
z[u_, v_] = 4 + Sin[v];

ParametricPlot3D[{4 + (3 + Cos[v]) Sin[u], 4 + (3 + Cos[v]) Cos[u],
  4 + Sin[v]}, {u, 0, 2 Pi}, {v, 0, 2 Pi},
 PlotStyle ->
  Texture[
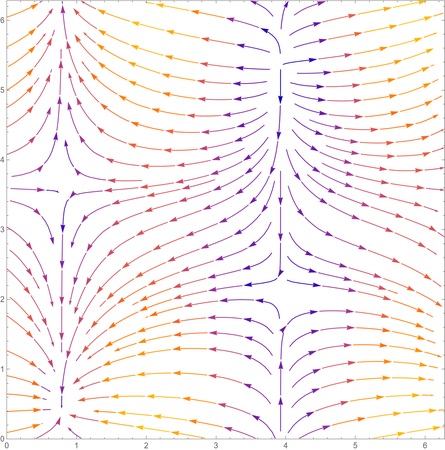
   StreamPlot[
    Evaluate[D[f[x[u, v], y[u, v], z[u, v]], {{u, v}}]], {u, 0,
     2 Pi}, {v, 0, 2 Pi}, Frame -> None, ImageSize -> Large]],
 Mesh -> None, ImageSize -> Large, PlotPoints -> 100,
 PlotRange -> {{0, 8}, {0, 8}, {0, 7}}]
The vector field isn't plotted around the outside of the torus, how do I get Mathematica to plot the entire vector field?


