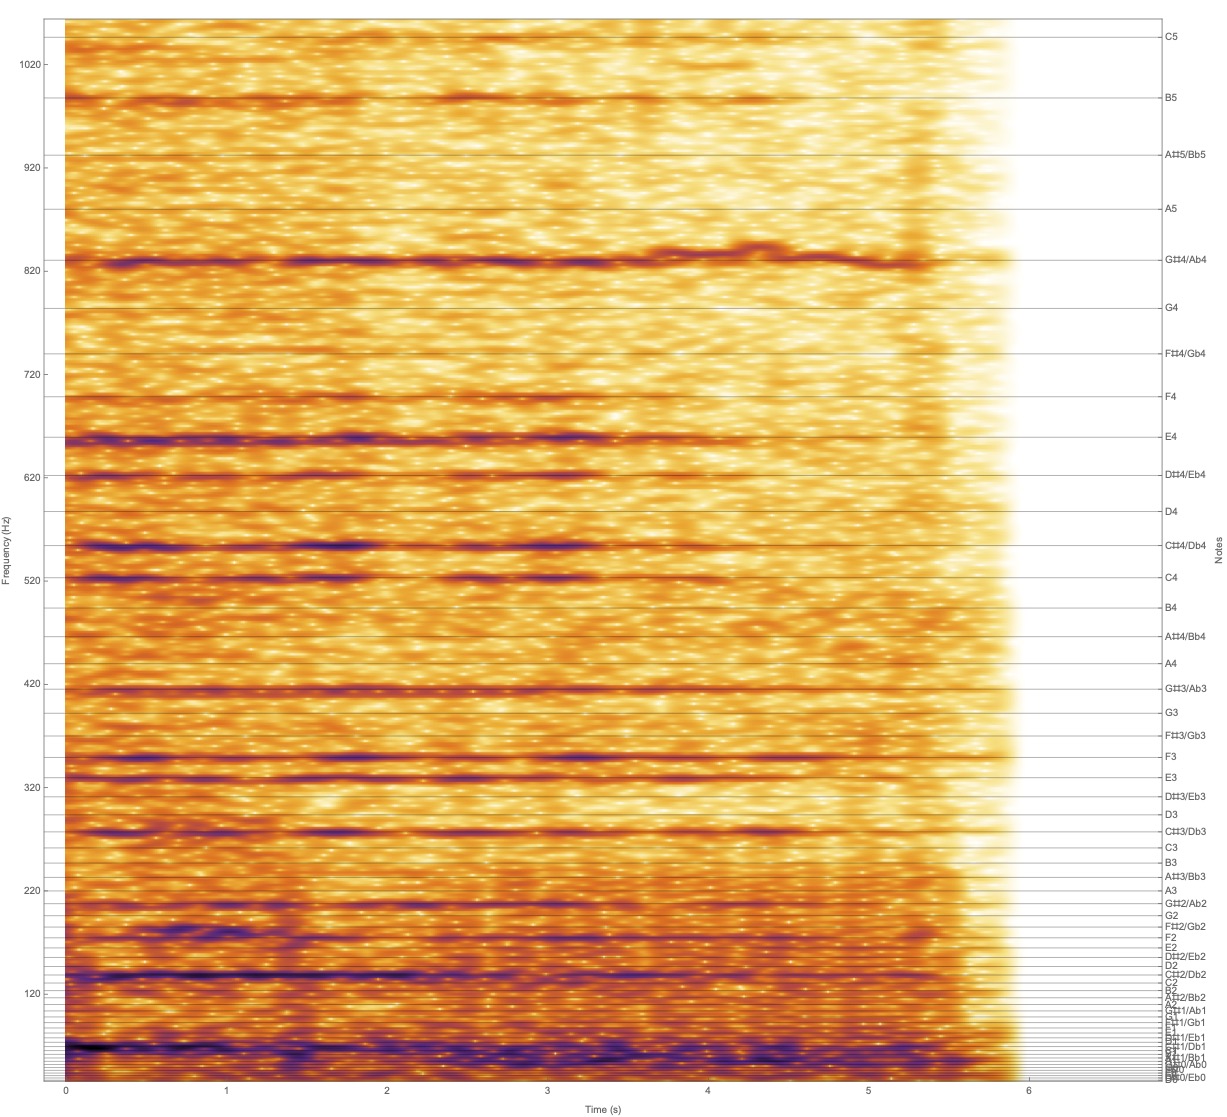
Some time ago I wrote a program to analyse a short segment of music and plot as a spectrogram in Mathematica. It allows one to find the notes in a weird chord for example. The example below is from the opening chord of 'The Meeting of the Spirits' from the Mahavishnu Orchestra's 'The Inner Mounting Flame'. It picks out the following notes: F, Ab, Db, E (FmM7#5?)which can be played on the guitar starting on the 4th string. Here is the plot:
I hadn't used the program for a while (several releases of Mathematica and MacOS ago), but when running it again it no longer worked properly and produced a low spectral resolution plot only. Note that I am only interested in frequencies below 1000Hz or so, but they need to be well resolved. Here is the code fragment":
data = Import["filename.aif", "AIFF"]
notes = Thread[{27.5*2^(Range[0, 72]/12), {"A0", "A#0/Bb0", "B0",
"C0", "C#0/Db0", "D0", "D#0/Eb0", "E0", "F0", "F#0", "G0",
"G#0/Ab0", "A1", "A#1/Bb1", "B1", "C1", "C#1/Db1", "D1",
"D#1/Eb1", "E1", "F1", "F#1/Gb1", "G1", "G#1/Ab1", "A2",
"A#2/Bb2", "B2", "C2", "C#2/Db2", "D2", "D#2/Eb2", "E2", "F2",
"F#2/Gb2", "G2", "G#2/Ab2", "A3", "A#3/Bb3", "B3", "C3",
"C#3/Db3", "D3", "D#3/Eb3", "E3", "F3", "F#3/Gb3", "G3",
"G#3/Ab3", "A4", "A#4/Bb4", "B4", "C4", "C#4/Db4", "D4",
"D#4/Eb4", "E4", "F4", "F#4/Gb4", "G4", "G#4/Ab4", "A5",
"A#5/Bb5", "B5", "C5", "C#5/Db5", "D5", "D#5/Eb5", "E5", "F5",
"F#5/Gb5", "G5", "G#5/Ab5", "A6"}}]


Show[Spectrogram[data, 8192, 256, BlackmanWindow, AspectRatio -> 0.95,PlotRange -> {80, 1030}],FrameTicks -> {Range[0, 1], Range[20, 2000, 100], {}, notes},GridLines -> {None, notes[[All, 1]]}, GridLinesStyle -> Opacity[0.3],Method -> {"GridLinesInFront" -> True},FrameLabel -> {"Time (s)", "Frequency (Hz)", "", "Notes"}]
So I would expect that I could simply increase the partition size to increase the resolution in the spectral domain, but this does not seem to work. It works up to about n=256, but after that it does not improve even with 8192 or higher. Is there a limit on partition size, and if so can I override it? Any suggestions gratefully received. Anyone aware of any changes to the Spectrogram code under the bonnet - probably several years ago?

