6
$\begingroup$

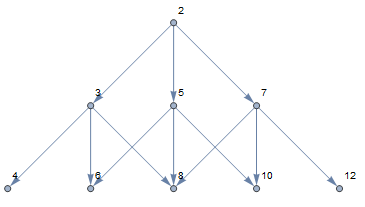
For $n\leq 3$, the following code works as expected:

n = 3;
NestGraph[# + {1, 3, 5} &, 2, n - 1, VertexLabels -> Automatic]

Enter image description here

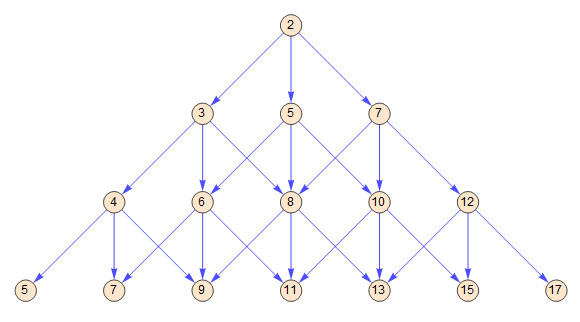
For $n=4$, I want to get a graph looks like this, but the code no longer works as expected, even when I try to change GraphLayout.

I think it may be because of the duplicate node in the graph. So, is there a proper way to generate the following graph?

Enter image description here

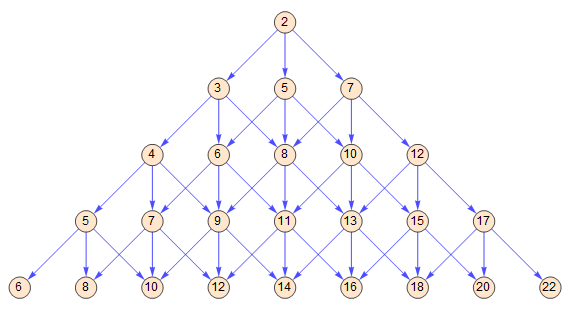
For $n=5$

Enter image description here

$\endgroup$
2
  • $\begingroup$ Are the vertices labeled 5 the same or distinct? (Ditto for the other duplicate expressions.) Another way to put it, do you want the graph or the graphics? $\endgroup$
    – Michael E2
    Commented Jan 11, 2022 at 4:53
  • $\begingroup$ @MichaelE2 Both can be, graph is preferred. $\endgroup$
    – expression
    Commented Jan 11, 2022 at 5:13

2 Answers 2

5
$\begingroup$

Update 2:

ClearAll[nG0]
nG0 = NestGraph[x |-> (F @@ (List @@ x + {#, 1}) & /@ {1, 3, 5}), 
    F[2, 1], #, 
    VertexLabels -> {v_ :> Placed[v[[1]], Center]}, ##2, 
    VertexSize -> Large, VertexStyle -> LightOrange] &;

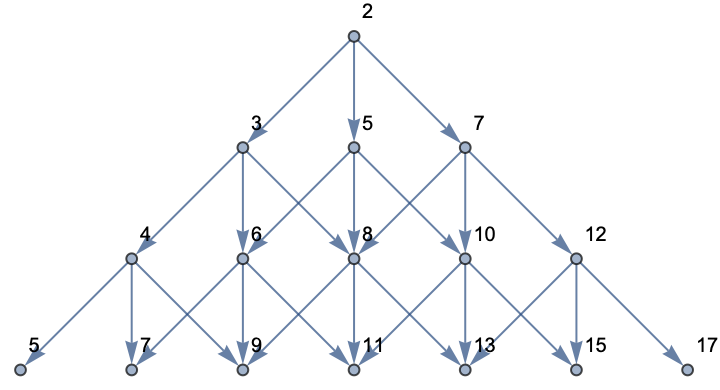
Examples:

nG0[#, ImageSize -> 1 -> 50] & /@ {3, 5} // Row
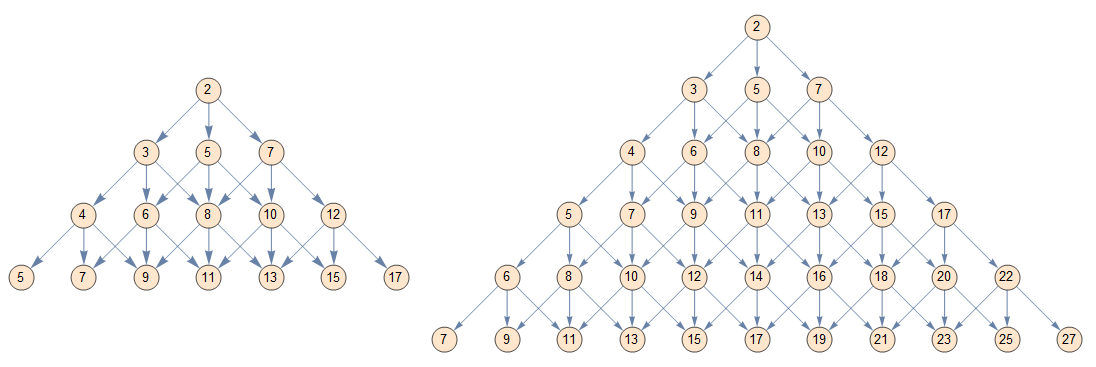
enter image description here

Original answer:

ClearAll[f, nG]

f = Apply[Join]@Map[(x |-> # + x) /@ Thread[{1, {1, 3, 5} }] &];

nG = NestGraph[f, {{1, 2}}, # - 1, 
    VertexLabels -> {v_ :> Placed[v[[2]], Center]}, ##2, 
    VertexSize -> Large, ImageSize -> Large] &;

Examples:

nG[3, VertexLabelStyle -> 16, VertexStyle -> LightOrange]
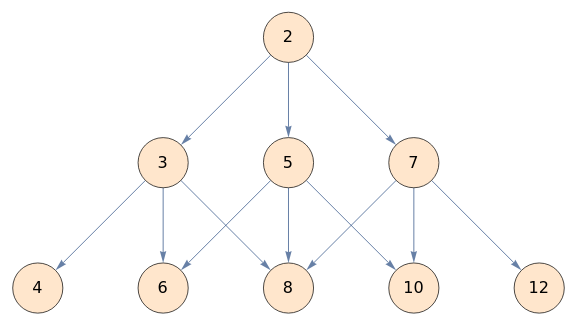
enter image description here

Grid[Partition[nG[#, ImageSize -> 1 -> 40, 
     PlotLabel -> Style[PromptForm["n", #], 16, Black]] & /@ Range[2, 7], 2], 
   Dividers -> All] 
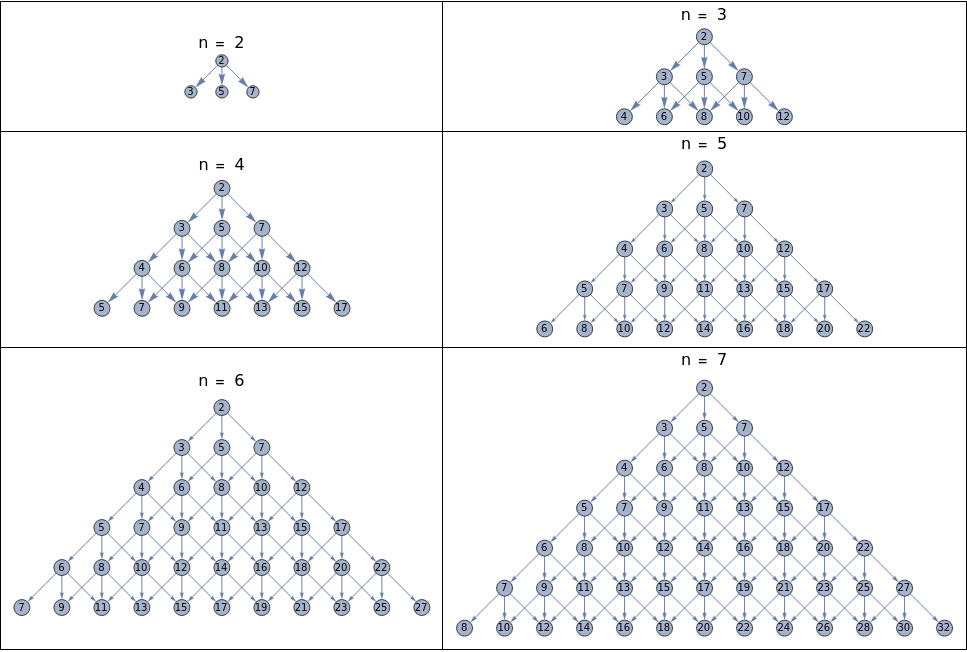
enter image description here

$Version

"13.0.0 for Linux x86 (64-bit) (November 22, 2021)"

Update: For versions before v13.0:

ClearAll[edgeList, graph]

edgeList = Rest @*Flatten @
    NestList[Flatten @* Map[(x \[Function] DirectedEdge[#, # + x]) /@ 
         Thread[{1, {1, 3, 5}}] &] @* DeleteDuplicates @*
      Map[Last], {0 -> {1, 2}}, # - 1] &;

graph = Graph[edgeList[#], 
    VertexLabels -> {v_ :> Placed[v[[2]], Center]}, ##2, 
    VertexSize -> Large, ImageSize -> Large] &;

Example:

graph[7]
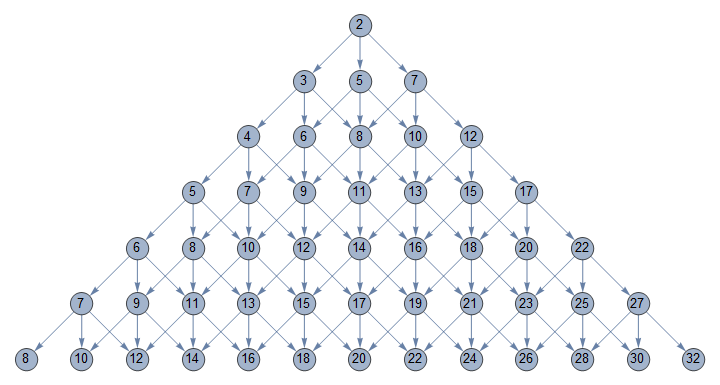
enter image description here

$\endgroup$
2
  • $\begingroup$ Thansk, but it doesn't works on version 12.x. $\endgroup$
    – expression
    Commented Jan 11, 2022 at 11:17
  • $\begingroup$ @expression, please see the update for versions older than 13.0. $\endgroup$
    – kglr
    Commented Jan 11, 2022 at 12:47
5
$\begingroup$

Not pretty, but it works

NestGraph[Function[x, C @@ (List @@ x + {1, #}) & /@ {-1, 0, 1}], 
  C[0, 2], 3, VertexLabels -> C[x_, y_] :> 3 x + 2 y - 2]

graph

Here C is used as an artificial wrapper to represent a 'point', since using bare lists would mess with both the initial specification of C[0,2] and the function nesting.

As Michael E2 hints, it's not possible for graphs to have multiple of the same vertex -- just like in set theory sets can't have multiple elements. So in this graph I'm using the Labels to superficially give some vertices the same name: internally, each vertex is indexed by a unique point (it's cartesian coordinate, in these layouts).


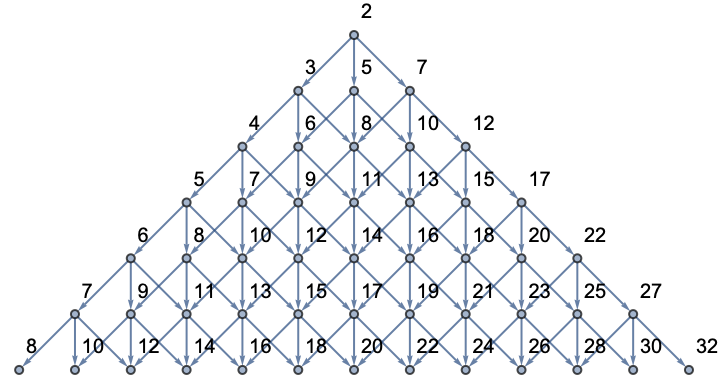
When n=7,

NestGraph[Function[x, C@@(List@@x+{1,#})& /@ {-1,0,1}], 
  C[0,2], n-1, VertexLabels -> C[x_,y_]:>3x+2y-2]

yields

graphbig

$\endgroup$

Your Answer

By clicking “Post Your Answer”, you agree to our terms of service and acknowledge you have read our privacy policy.

Not the answer you're looking for? Browse other questions tagged or ask your own question.