2
$\begingroup$

I want to plot the heat map of a two-variable function which has two arguments, but the function is continuous on the transition line.

However, the densityplot put no color on the transition line.

Here is an example

r[x_, y_] = If[x^2 + y^2 <= 1, x^2 + y^2, If[x^2 + y^2 >= 1, 1]]
DensityPlot[r[x, y], {x, -2, 2}, {y, -2, 2}, PlotRange -> All]

This gives the following image
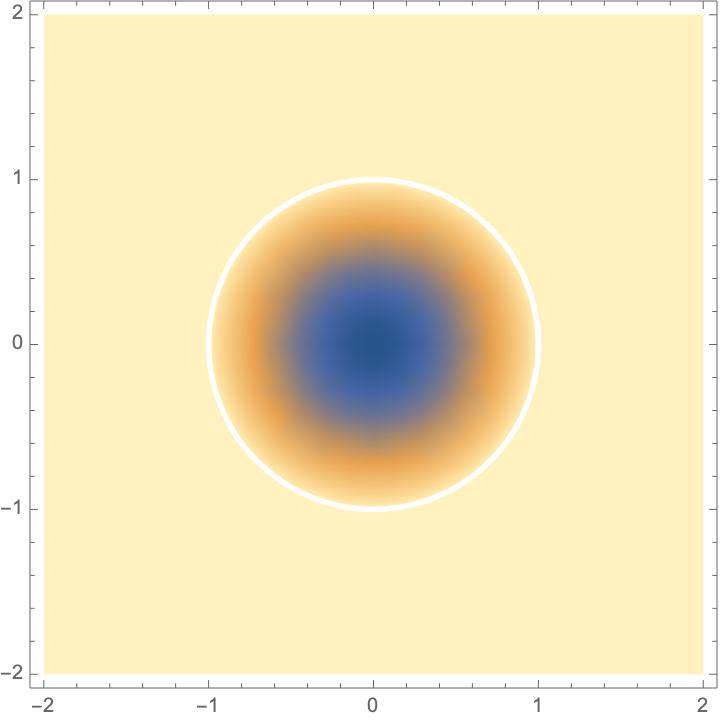
I want the white circle to be coloured as 1.

$\endgroup$
1
  • 1
    $\begingroup$ Welcome to Mathematica.StackExchange. Use the option, Exclusions -> None. $\endgroup$
    – bbgodfrey
    Commented Nov 24, 2021 at 14:57

1 Answer 1

6
$\begingroup$
r[x_, y_] = If[x^2 + y^2 <= 1, x^2 + y^2, If[x^2 + y^2 >= 1, 1]];
DensityPlot[r[x, y], {x, -2, 2}, {y, -2, 2}, PlotRange -> All, 
 Exclusions -> None, PlotPoints -> 100]

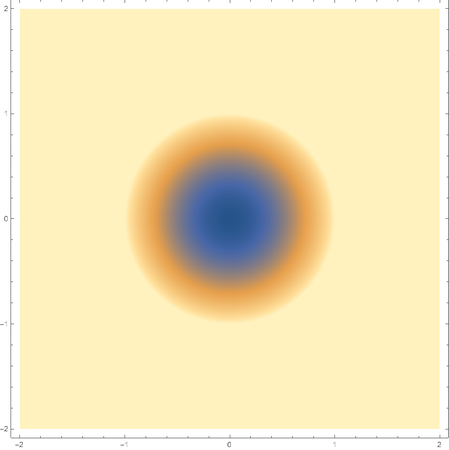
enter image description here

$\endgroup$

Your Answer

By clicking “Post Your Answer”, you agree to our terms of service and acknowledge you have read our privacy policy.

Not the answer you're looking for? Browse other questions tagged or ask your own question.