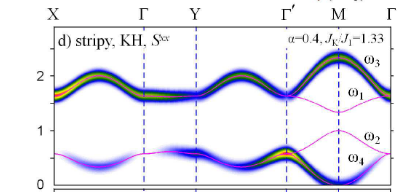
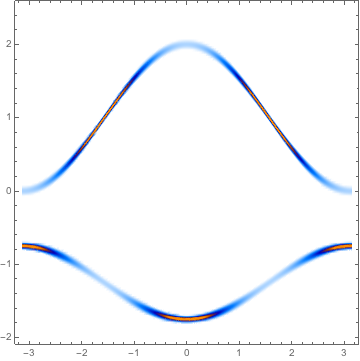
I have a question that I think is simple. I know a function y=f(x), just like the pink line in the plot below. Now, there is always an error associated to this function, and so one thinks of plotting a function I(x,y)=NormalDistribution[f(x),\sigma] for each value of x (see Figure for clearer idea). My question is if I can plot such a function using "Plot" instead of "DensityPlot". The reason for this is that I want to plot something like the figure below, and I couldn't integrate the two types of plot. In particular, I want a clean white background for the DensityPlot when I(x,y) is close to zero, and I couldn't find color functions that do this.
1 Answer
$\begingroup$
$\endgroup$
1
I recommend to use DensityPlot, but with a custom color scheme having a lot of white
scheme = (Blend[{White, White, RGBColor[0, 0.48, 1],
      RGBColor[0, 0, 0.73], RGBColor[0.6, 0.22, 0],
      RGBColor[1, 0.55, 0]}, Rescale[#1, {0, 10}]] &);
BarLegend[{scheme[#] &, {0, 10}}]
Now you can use DensityPlot setting ColorFunctionScaling -> False
DensityPlot[
 PDF[CauchyDistribution[1 + 1 Cos[x], 0.1 Cos[x]^2 + 0.02], y] +
  PDF[CauchyDistribution[-5/4 - 1/2 Cos[x], 0.1 Sin[x]^2 + 0.02],
   y], {x, -Pi, Pi}, {y, -2, 2.5}, ColorFunction -> scheme,
 ColorFunctionScaling -> False, PlotRange -> All, PlotPoints -> 150]
-
1$\begingroup$ thanks a lot for your help. It looks indeed close to what I want $\endgroup$ Commented Nov 3, 2021 at 9:39


