The problem: I combine two lists in one DateListPlot. The first list has labels. When I combine both in one DateListPlot, some of the labels are not visible.
data = {
 {DateObject[{2021, 01, 01}], 1,"label1"},
 {DateObject[{2021, 01, 02}], 2, "label2"},
 {DateObject[{2021, 01, 03}], 3,"label3"},
 {DateObject[{2021, 01, 04}], 4,"label4"},
 {DateObject[{2021, 01, 05}], 5,"label5"},
 {DateObject[{2021, 01, 06}], 6,"label6"},
 {DateObject[{2021, 01, 07}], 7,"label7"},
 {DateObject[{2021, 01, 08}], 8,"label8"},
 {DateObject[{2021, 01, 09}], 9,"label9"},
 {DateObject[{2021, 01, 10}], 10,"label10"},
 {DateObject[{2021, 01, 11}], 11,"label11"},
 {DateObject[{2021, 01, 12}], 12, "label12"}
};
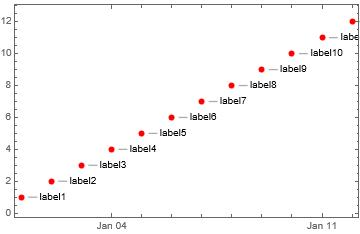
When I visualise data like:
graf1 = DateListPlot[Rule[data[[All, {1, 2}]], data[[All, 3]]]
  , PlotStyle -> {Red, PointSize[0.02]}
  , LabelingFunction -> Right
  , Joined -> False
  ]
The other datasets look like:
data1 = {
 {DateObject[{2021, 01, 01}], 10},
 {DateObject[{2021, 01, 02}], 1},
 {DateObject[{2021, 01, 03}], 9},
 {DateObject[{2021, 01, 04}], 2},
 {DateObject[{2021, 01, 05}], 8},
 {DateObject[{2021, 01, 06}], 3},
 {DateObject[{2021, 01, 07}], 9},
 {DateObject[{2021, 01, 08}], 8},
 {DateObject[{2021, 01, 09}], 6},
 {DateObject[{2021, 01, 10}], 5},
 {DateObject[{2021, 01, 11}], 7},
 {DateObject[{2021, 01, 12}], 4}
};
When I combine both datasets in one graph like:
graf2 = DateListPlot[{data1[[All, {1, 2}]],
   Rule[data[[All, {1, 2}]], data[[All, 3]]]}
  , PlotStyle -> {Blue, Red}
  , Joined -> {True, False}
  , Frame -> {{True, False}, {True, True}},
  PlotRangePadding -> {{.75, Automatic}, {5, Automatic}}
  ];
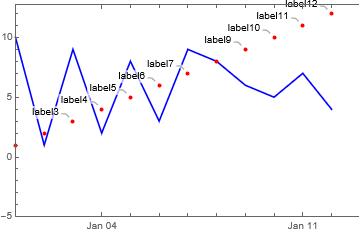
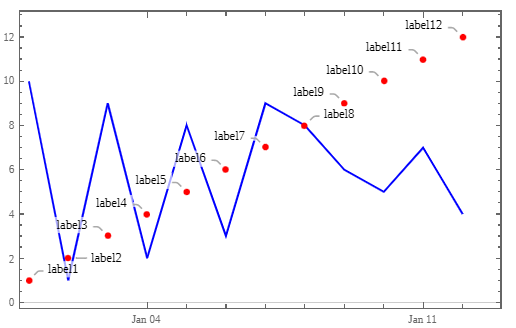
Now the output looks like:
As you can see, the labels 'label1', 'label2', and 'label8' are not visible.
Does anyone have a suggestion on how to solve this issue?


