4
$\begingroup$

Working on a DateListPlot in Mathematica 12.1, and I only want to label the last point in the resulting chart with the second value (the number of COVID-19 cases). How?

Here's the code I have thus far (minus the first line, which is a CloudConnect command to get the data.) The ResourceObject call in the first line below is an effort to force it to get the latest data.

resource = ResourceObject["Epidemic Data for Novel Coronavirus COVID-19"];
data = ResourceData["Epidemic Data for Novel Coronavirus COVID-19"][Select[MatchQ[Entity["Country","UnitedStates"],#Country]&&!MissingQ[#AdministrativeDivision]&]][GroupBy["Country"]][ All, Total, #ConfirmedCases &];
diffs = Differences[data[Entity["Country","UnitedStates"]]];
Export["/home/pi/Pictures/COVIDCharts.png",Row[{DateListPlot[data,PlotLabel->"Total COVID-19 Cases, U.S.", PlotRange->All,PlotTheme->"Detailed",ImageSize->Large,LabelingFunction->(# &)],
DateListPlot[diffs,PlotLabel->"Daily New Cases Reported, U.S.", PlotRange->All,PlotTheme->"Detailed",ImageSize->Large,LabelingFunction->(# &)]}]]

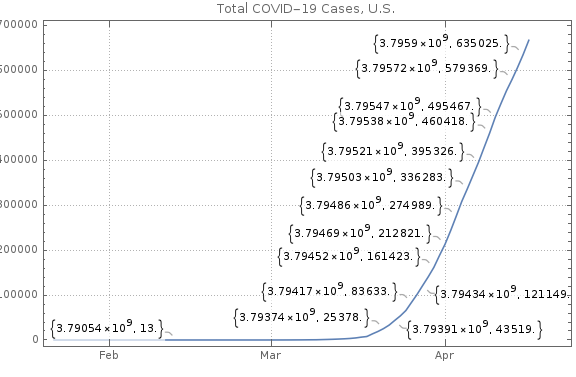
Image of the first chart

$\endgroup$
2
  • $\begingroup$ Update to my own posting: I figured out using #[[2]] gives me just the second value (with a decimal point at the end); just now need to know how to only show the latest (last) value. $\endgroup$ Commented Apr 18, 2020 at 2:25
  • $\begingroup$ Quite related ?mathematica.stackexchange.com/q/219501/1089 $\endgroup$
    – chris
    Commented Apr 18, 2020 at 10:17

1 Answer 1

2
$\begingroup$
Row[{DateListPlot[data, 
   PlotLabels -> {Column @ {DateString @ First[Normal[Values[data]]] @ "LastTime", 
       First[Normal[Values[data]]] @ "LastValue"}}, 
   PlotLabel -> "Total COVID-19 Cases, U.S.", PlotRange -> All, 
   PlotTheme -> "Detailed", ImageSize -> 550], 
  DateListPlot[diffs, 
   PlotLabels -> {Column @ {DateString @ diffs @ "LastTime", diffs @ "LastValue"}}, 
   PlotLabel -> "Daily New Cases Reported, U.S.", PlotRange -> All, 
   PlotTheme -> "Detailed", ImageSize -> 550]}, Spacer[10]]

enter image description here

Or

label1 = Placed[Column@
  {DateString[#, {"MonthName", " ", "Day", ", ", "Year"}], #2} & @@ 
    (First[Normal[Values[data]]] /@ {"LastTime", "LastValue"}), After];

label2 = Placed[Column@
  {DateString[#, {"MonthName", " ", "Day", ", ",  "Year"}], #2} & @@ 
    (diffs /@ {"LastTime", "LastValue"}),  After];

Row[{DateListPlot[data, PlotLabels -> label1, 
   PlotLabel -> "Total COVID-19 Cases, U.S.", PlotRange -> All, 
   PlotTheme -> "Detailed", ImageSize -> 550], 
  DateListPlot[diffs, PlotLabels -> label2, 
   PlotLabel -> "Daily New Cases Reported, U.S.", PlotRange -> All, 
   PlotTheme -> "Detailed", ImageSize -> 550]}, Spacer[10]]

enter image description here

$\endgroup$
2
  • $\begingroup$ This is the answer I'm looking for; but I need the layout of the first solution with the label format (date only) of the second; I'll keep pluggin'. :-) $\endgroup$ Commented Apr 20, 2020 at 19:31
  • 1
    $\begingroup$ Figured it out, it's admittedly a kludge: StringReplace[DateString @ data @ "LastDate"," 12:00 am"->""] $\endgroup$ Commented Apr 20, 2020 at 19:42

Your Answer

By clicking “Post Your Answer”, you agree to our terms of service and acknowledge you have read our privacy policy.

Not the answer you're looking for? Browse other questions tagged or ask your own question.