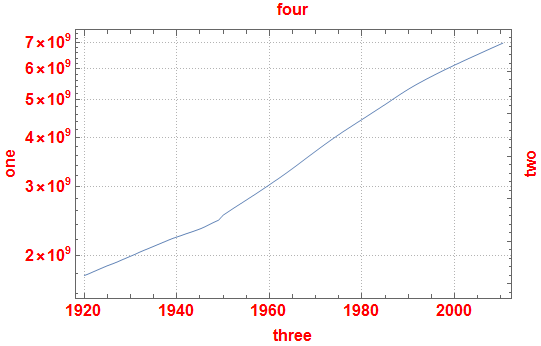
I have the following code:
names = CountryData[];
data = CountryData[#, {"Population", {1920,2010}}] &/@ names;
cleaned = DeleteMissing[data/.{}->Nothing];
sum = TimeSeriesThread[Total, cleaned];
DateListLogPlot[sum, AxesLabel->{"Time (Years)", "Log(Population)"}]
This gives the estimated world population increase as a function of time on a Log plot.
I would like to be able to explicitly label my axes, but this doesn't seem to work with DateListPlot or DateListLogPlot. AxesLabel doesn't throw an error when passed to either of these functions, but it also doesn't result in the desired output.
Checking over the docs for DateListPlot, AxesLabel doesn't appear as an option, and none of the example plots have y-axis labels.
Am I missing something obvious, or is there really no way to title/label the y-axis in DateListPlot or DateListLogPlot?

