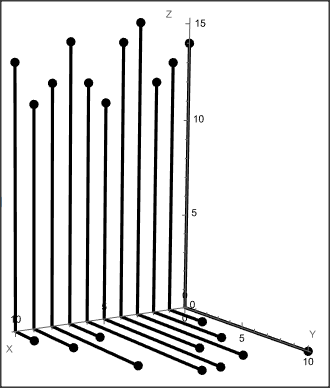
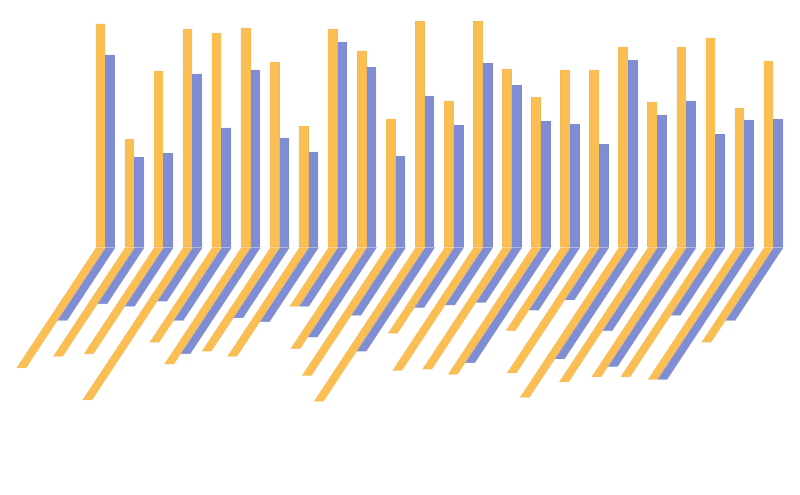
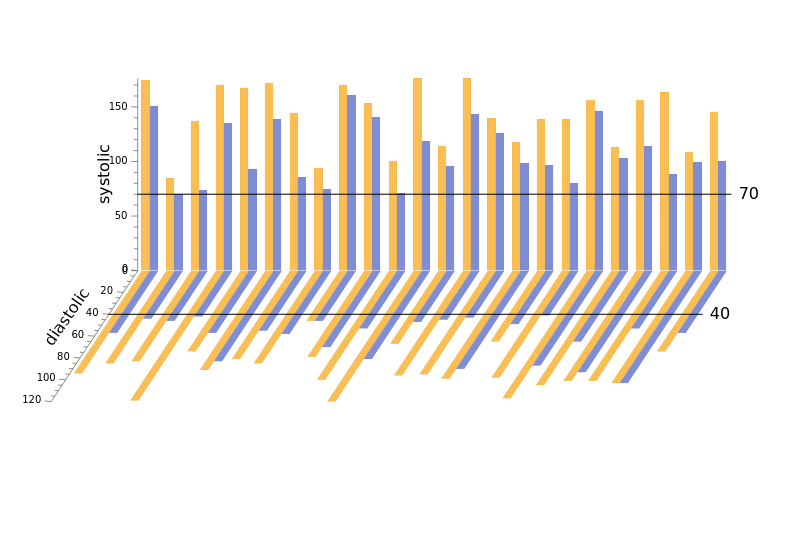
Seeking advice for how to construct an oblique chart plot of {x,y} and {x,z} value lists in a 3D View where the viewer can trace a line from {x,y,0} to {x,0,0}, and then jump to the associated {x,0,z} value.
Idea here is to present two related variables sharing a common x-value on one graphic.
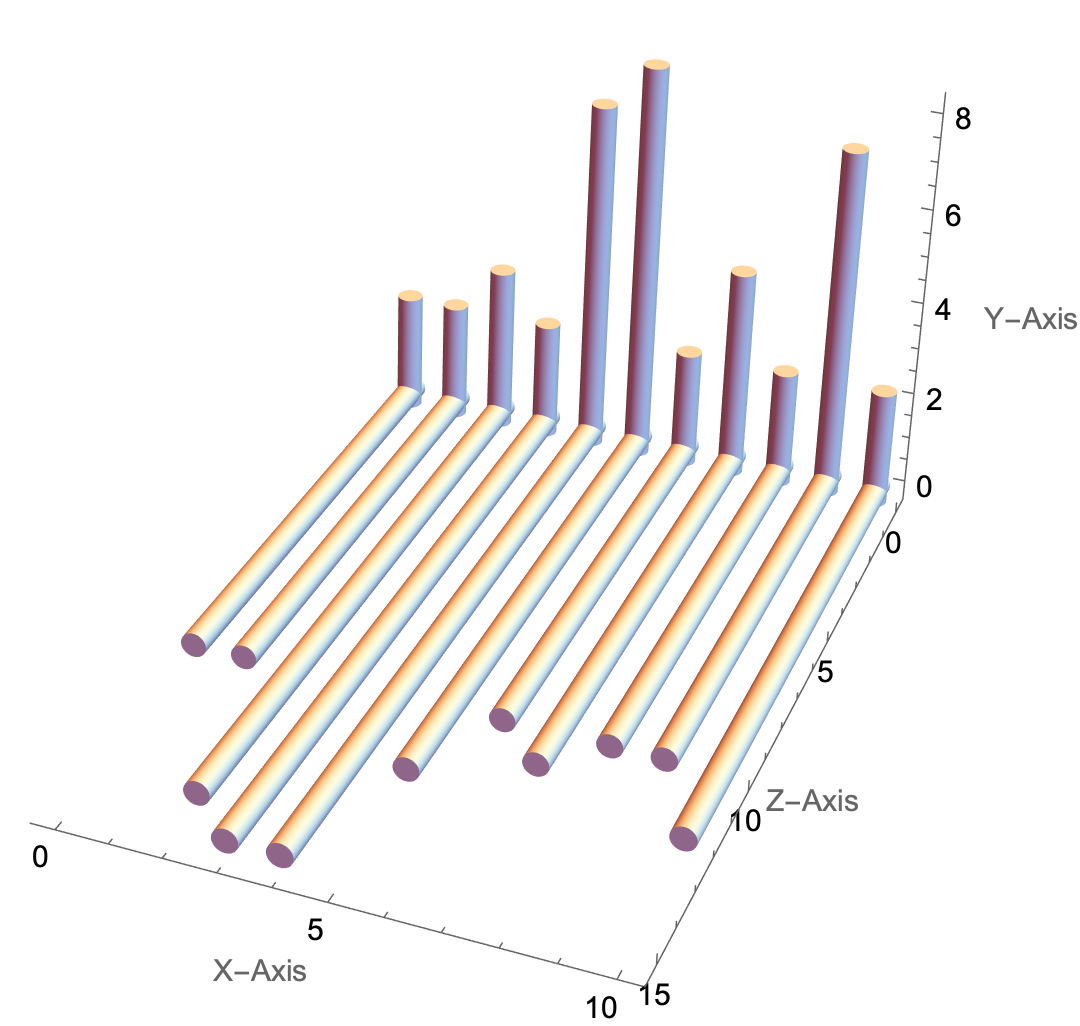
In the following sample code of 10 points (although I typically have to present hundreds of points), I have two (possibly 3) issues in my code:
{x,0,z} points are correctly connected via the line to their corresponding {x,0,0} point. How do I specify the same for the {x,y,0} points so that they match up with their corresponding {x,0,0} point?
How do I eliminate the bounding 3D Box view?
Am I completely headed in the wrong direction (e.g., I should generate 2D ListPointPlots and then "marry" them at the X-Axis by projecting each as the inside face of a 3D cube)?
values[{x, z}] = Table[{i, 0, RandomInteger[{10, 15}]}, {i, 0, 10}];
values[{x, y}] = Table[{i, RandomInteger[{1, 10}], 0}, {i, 0, 10}];
ListPointPlot3D[{values[{x, z}], values[{x, y}]}
 , Filling -> Axis
 , AxesLabel -> {"X-Axis", "Y-Axis", "Z-Axis"}
 , ViewPoint -> {0, 2, 2.75}
 , ViewVertical -> {0, 1, 0.04}]
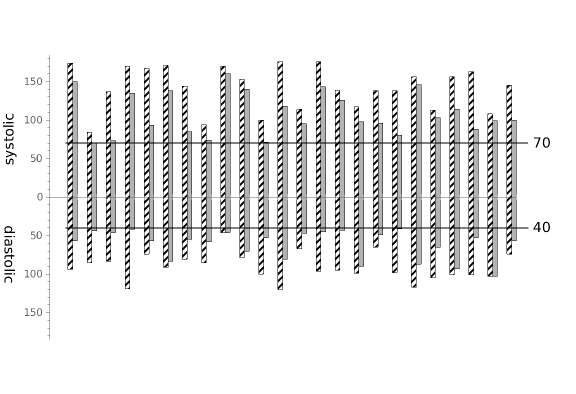
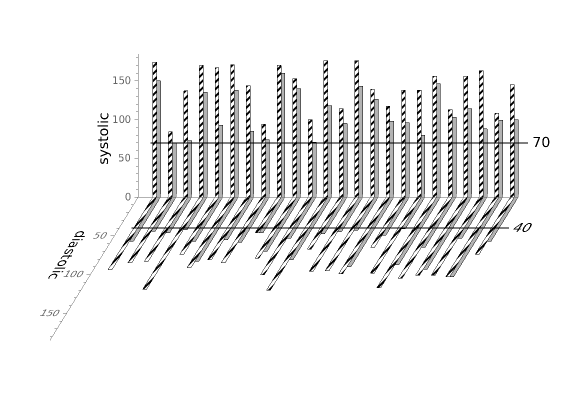
Attached is a reference example for an Oblique data chart of two variables relative to a common X-Value.

