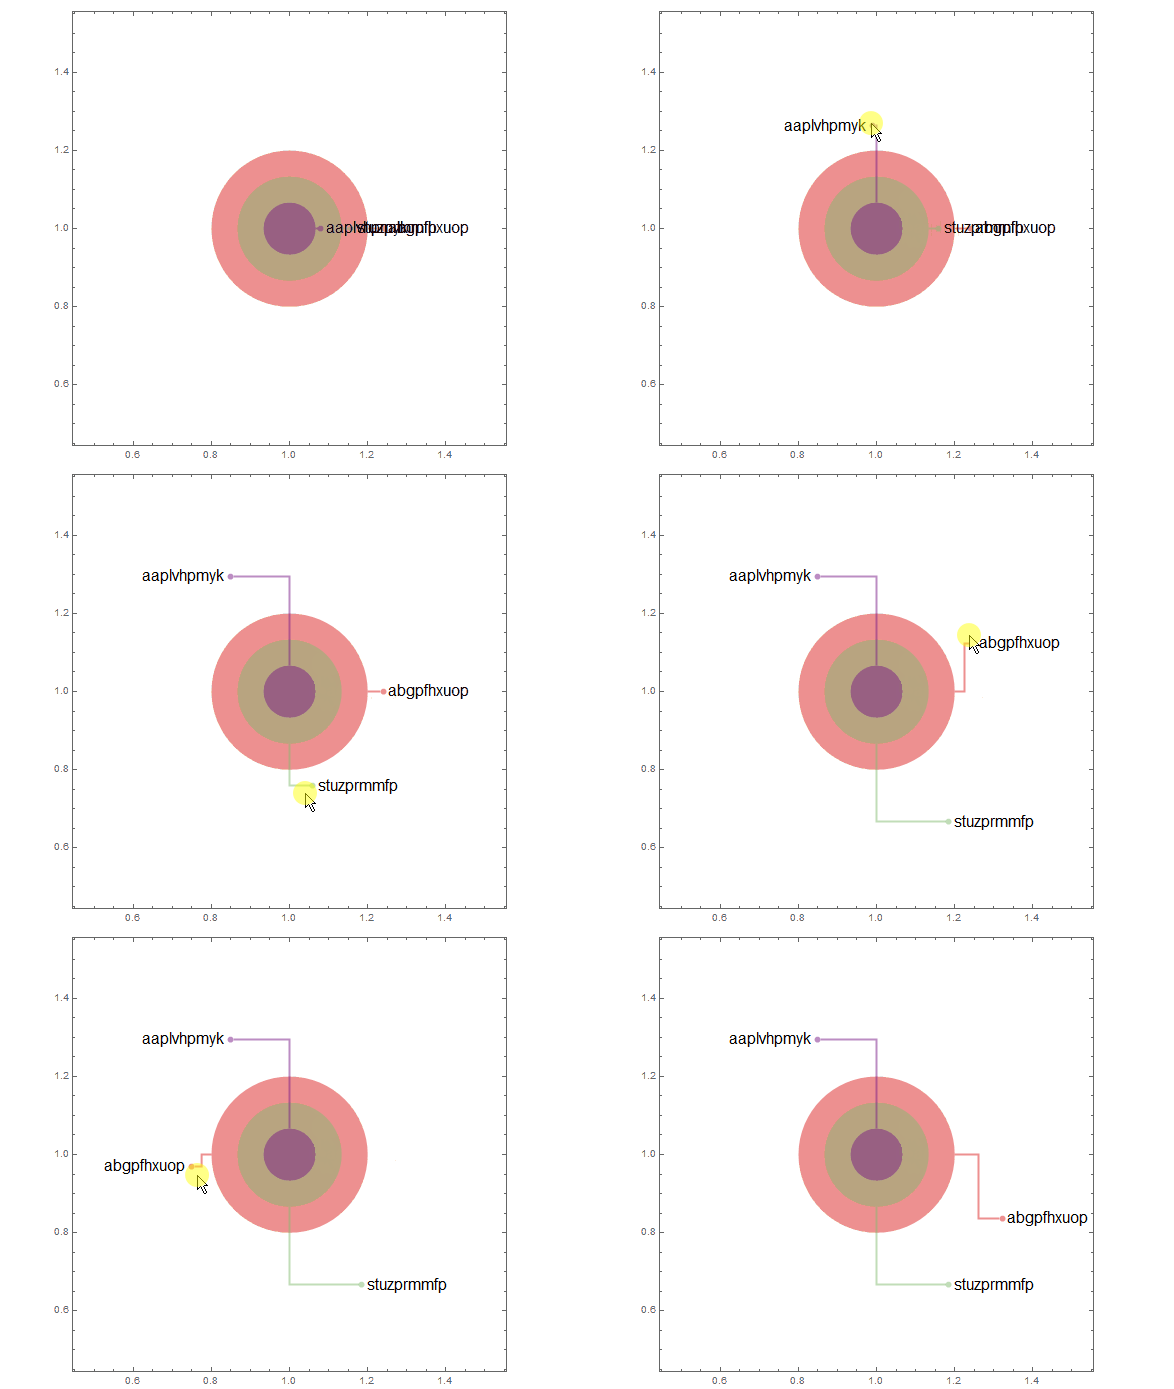
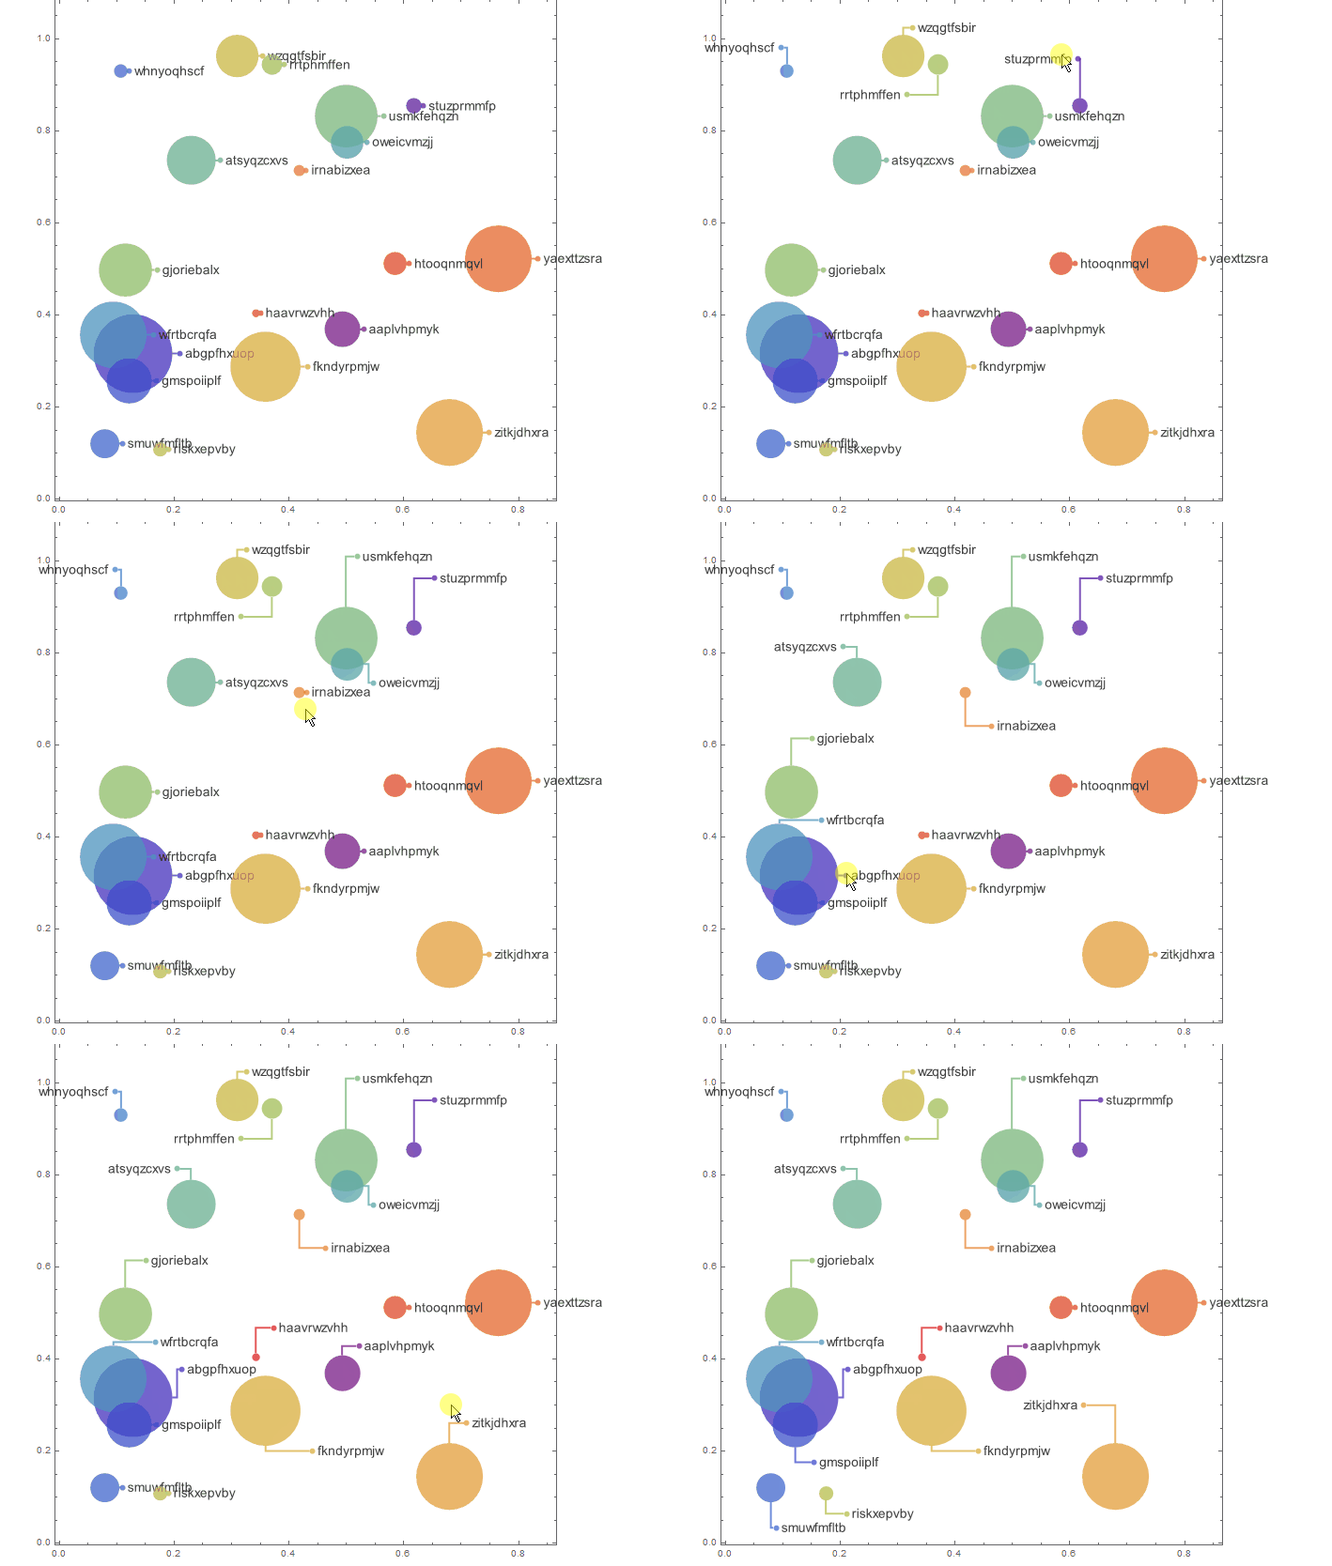
n = 20;
SeedRandom[77];

lbls = ResourceFunction["RandomString"][{n, 10}];
data = RandomReal[1, {n, 3}];
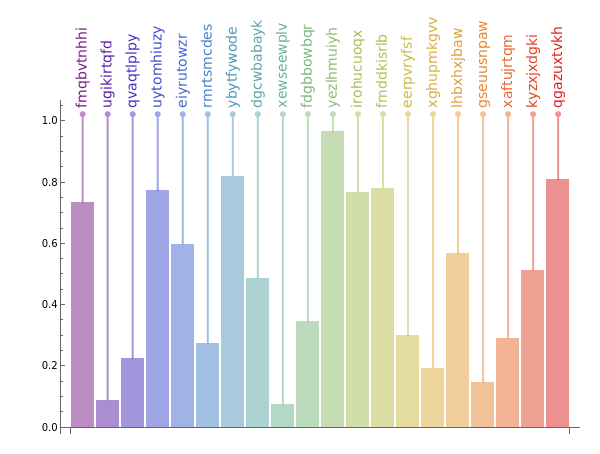
BubbleChart
Use Callout as wrapper on input data:
bubblechart = BubbleChart[MapThread[
      Callout[Style[#, Directive[EdgeForm[]]], #2, Automatic,
        Appearance -> "Leader",
        LabelVisibility -> All,
        CalloutMarker ->
           Arrowheads[{{0, 1}, {Automatic, 0,
             Graphics[{ Opacity[.5], Disk[Offset[{-5, 0}, {0, 0}], Offset[5]]}]}}],
        CalloutStyle ->
           {Directive[Thick, CapForm["Butt"], Opacity[.5], #3], Opacity[0]}] &,
    {data, Style[#, FontSize -> 14] & /@ lbls, ColorData[66] /@ Range[n]}],
  PerformanceGoal -> "Speed",
  ChartStyle -> 66,
  ChartBaseStyle -> Opacity[.5],
  ImageSize -> 600]
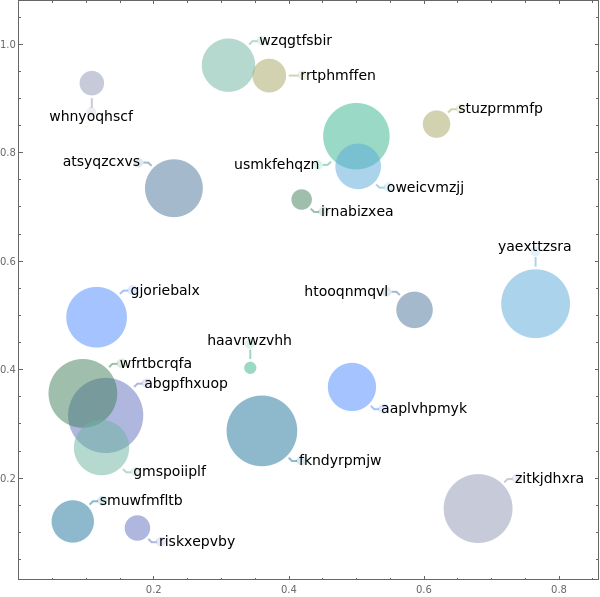
 postProcess = ReplaceAll[ {_Polygon -> {},
    Arrow[a_, ___] :> Arrow[a, {0, -.0075}],
    Text[a_, Offset[o_, b_], c_] :>
       Text[a /. Rule[FontSize, _] :> Rule[FontSize, Scaled[.025]],
        Offset[o/3, b], (-Sign@o) /. {0, y : Except[0]} :> y {-1.2, 0.5}]}];

 postProcess @ bubblechart
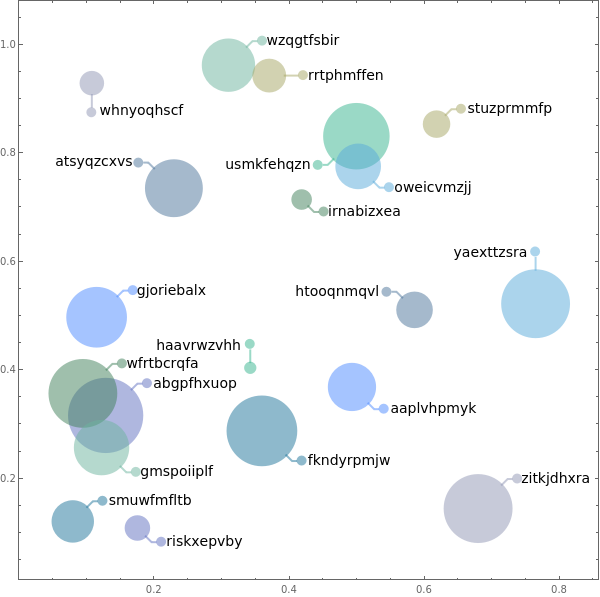
Show[postProcess @ bubblechart /.
   {Offset[5] -> Offset[3], Offset[{-5, 0}, p_] -> Offset[{-3, 0}, p]},
  ImageSize -> 400]
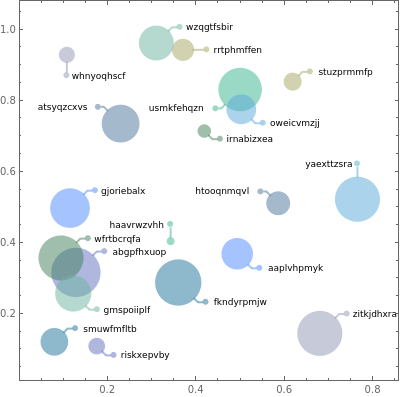
Notes: It is important (1) to use a large font size in printer points rather than in scaled size, and (2) to use a large image size in the original chart. Try using FontSize -> Scaled[.02] (instead of FontSize -> 14) and ImageSize -> 300 (instead of ImageSize -> 500) in the code above to see the reason.
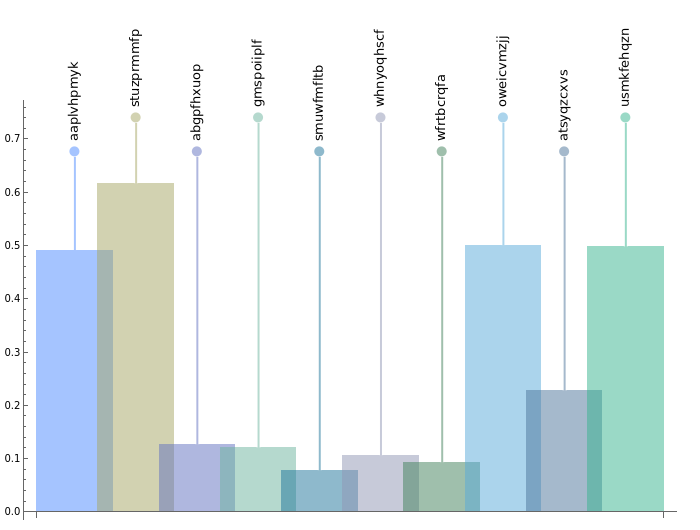
BarChart
data2 = data[[;; 10, 1]];
lbls2 = lbls[[;; 10]];

barchart = BarChart[
  MapThread[
    Callout[Style[#, Directive[EdgeForm[]]], #2, Automatic,
        Appearance -> "Leader",
        CalloutMarker ->
           Arrowheads[{{Automatic, 0,
             Graphics[{Opacity[.5], Disk[Offset[{-5, 0}, {0, 0}], Offset[5]]}]}}],
        LeaderSize -> {{Automatic, 90 Degree, 0}, {10, 0 Degree}},
        CalloutStyle ->
           Directive[Thick, CapForm["Butt"], Opacity[.5], #3]] &,
    {data2, Style[#, FontSize -> Scaled[.02]] & /@ lbls2, ColorData[66] /@ Range[10]}],
  ChartStyle -> 66,
  ChartBaseStyle -> Opacity[.5],
  ImageSize -> 800,
  BarSpacing -> - .1]
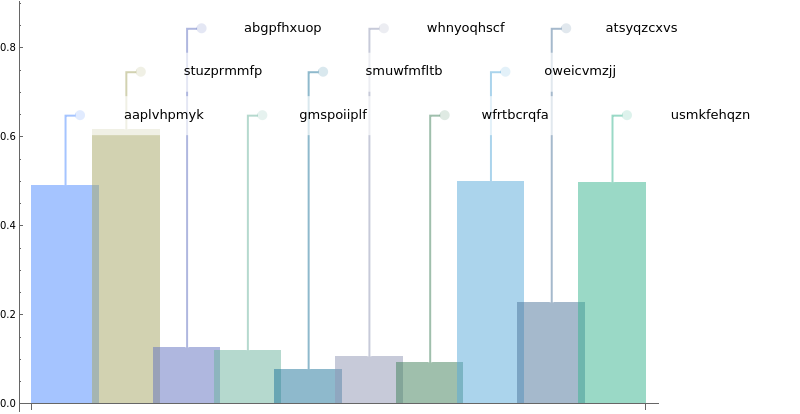
Show[ReplaceAll[{_Polygon -> {},
     Text[a_, Offset[o_, b_], c_] :>
        Text[a, Offset[o/4, b], {-Sign[o[[1]]], 0}]}] @ barchart,
    ImageSize -> 800, ImagePadding -> {{5, 50}, {5, 5}}]
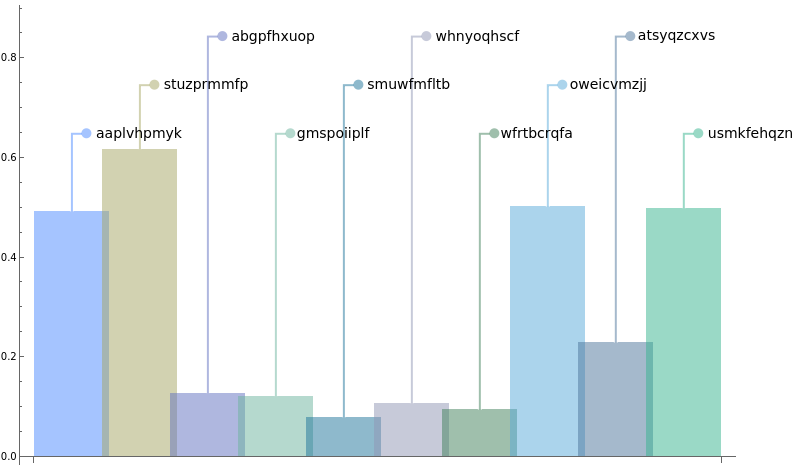
Show[ReplaceAll[{_Polygon -> {},
      Text[a_, Offset[o_, b_], c_] :>
       Text[a, Offset[{7, 10}, b], {-1, 1}, {0, 1}]}] @ barchart,
     ImageSize -> 800, ImagePadding -> {{5, 5}, {5, 90}}]
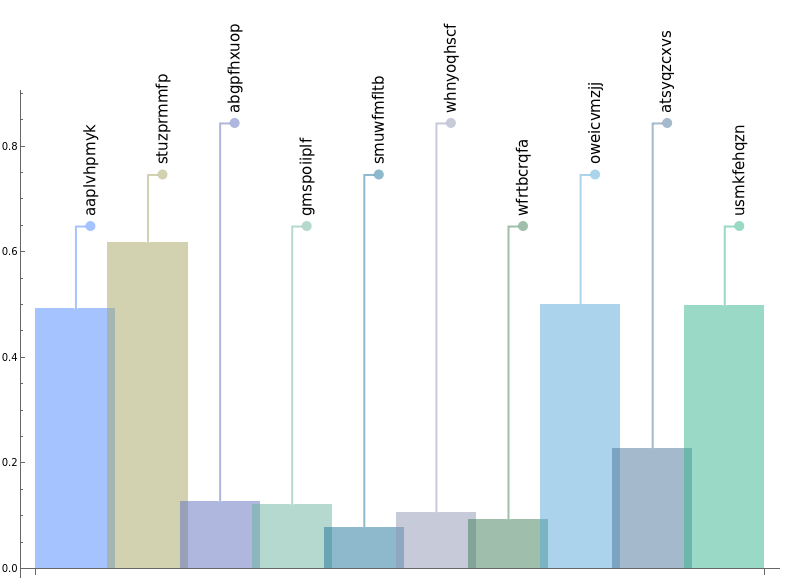
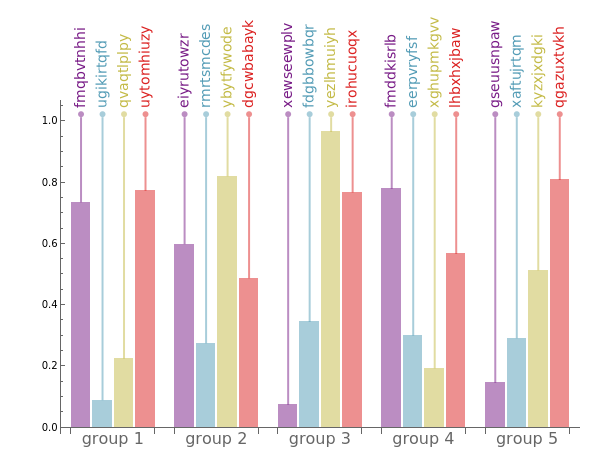
BarChart[MapThread[
   Callout[Style[#, Directive[EdgeForm[]]], #2, Automatic,
      CalloutMarker ->
          Arrowheads[{{Automatic, 0,
            Graphics[{Opacity[.5], Disk[Offset[{-5, 0}, {0, 0}], Offset[5]]}]}}],
      CalloutStyle -> Directive[Thick, CapForm["Butt"], Opacity[.5], #3]] &,
   {data2, Style[#, FontSize -> Scaled[.02]] & /@ lbls2, ColorData[66] /@ Range[10]}],
   ChartStyle -> 66,
   ChartBaseStyle -> Opacity[.5],
   ImageSize -> 700,
   ImagePadding -> {{10, 10}, {10, 100}},
   BarSpacing -> - .2] /.
 {_Polygon -> {} ,
  Text[a_, Offset[o_, b_], c_] :> Text[a, Offset[{0, 25}, b], {-1, 0}, {0, 1}]}
