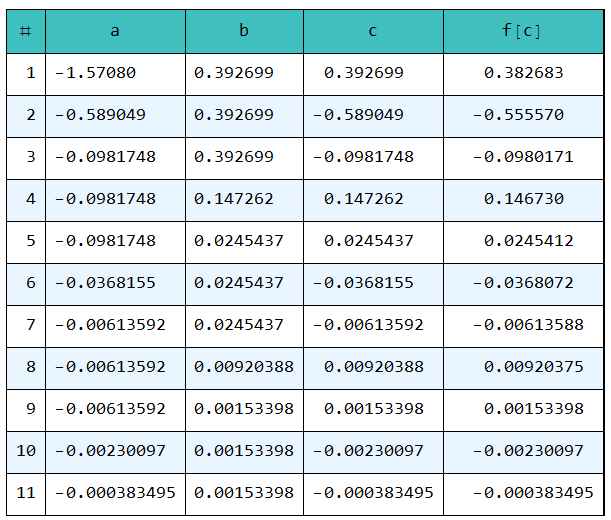
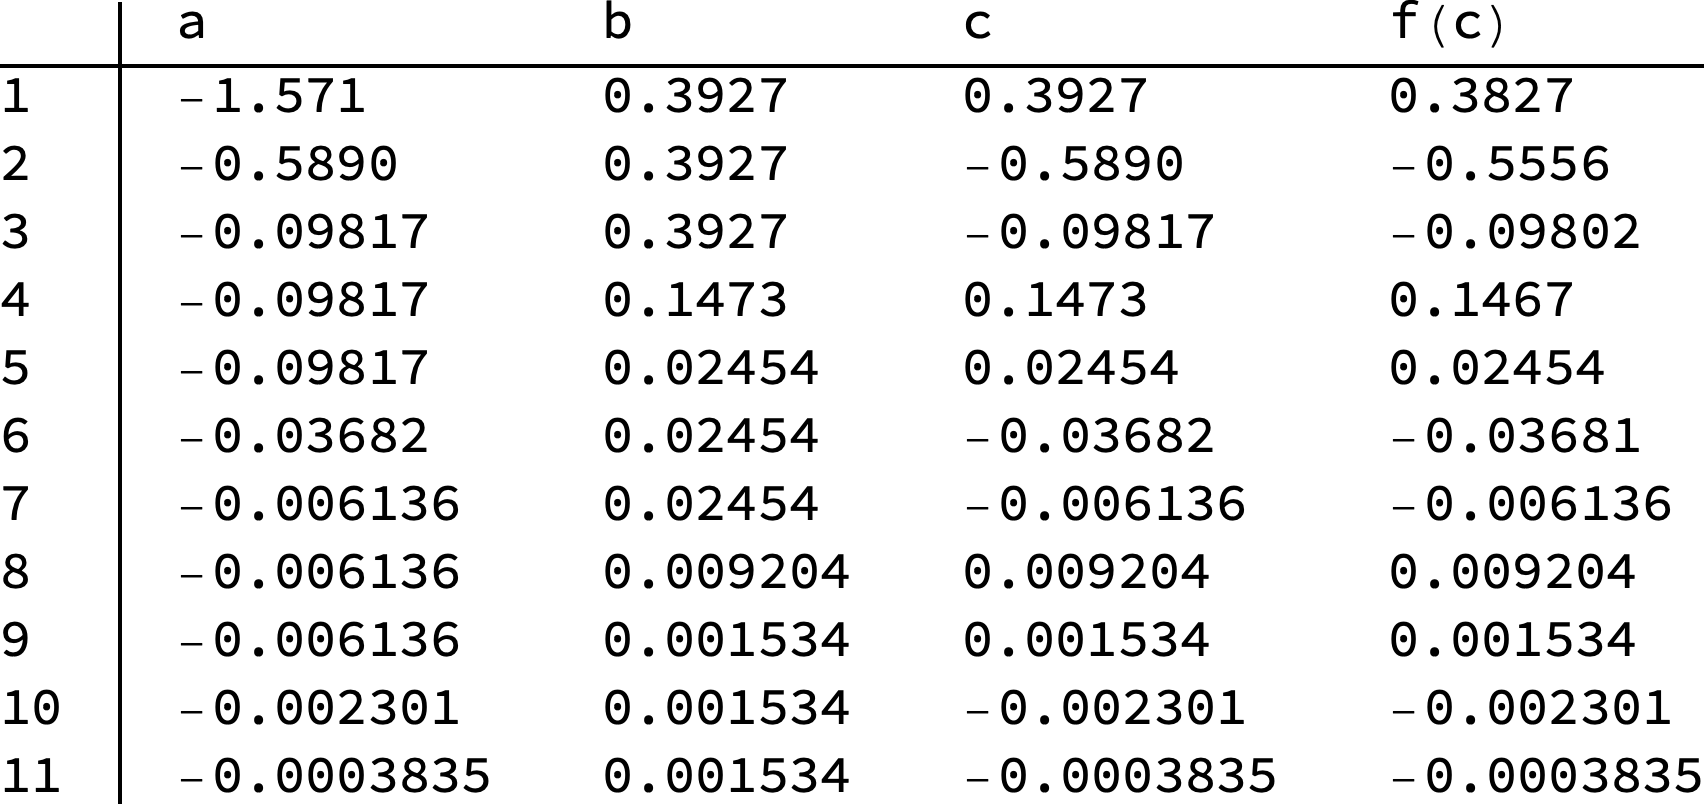
I have created a For loop that solves f(x)=0 using the Bisection method:
a = -Pi/2;
b = 3 Pi/4;
tolorance = 0.0000;
f[x_] := Sin[x] && a <= x <= b;
For[i = 1, i <= 11, i++,
 {c = (a + b)/2, If[f[a]*f[c] < tolorance, b = c, a = c],
  Print[{i, N[a, 4], N[b, 4], N[c, 4], N[f[c], 4]}]}]
This prints the following output:
{1,-1.571,0.3927,0.3927,0.3827}

{2,-0.5890,0.3927,-0.5890,-0.5556}

{3,-0.09817,0.3927,-0.09817,-0.09802}

{4,-0.09817,0.1473,0.1473,0.1467}

{5,-0.09817,0.02454,0.02454,0.02454}

{6,-0.03682,0.02454,-0.03682,-0.03681}

{7,-0.006136,0.02454,-0.006136,-0.006136}

{8,-0.006136,0.009204,0.009204,0.009204}

{9,-0.006136,0.001534,0.001534,0.001534}

{10,-0.002301,0.001534,-0.002301,-0.002301}

{11,-0.0003835,0.001534,-0.0003835,-0.0003835}
Which is correct. However I can not find a method to transform this into a table. Do any of you have ideas on how to do this, preferably with headers?
Thanks a lot in advance.


Table. $\endgroup$ForandPrint: mathematica.stackexchange.com/a/99170/1871 But, as toForloop, you should really read this post: mathematica.stackexchange.com/q/134609/1871 $\endgroup$