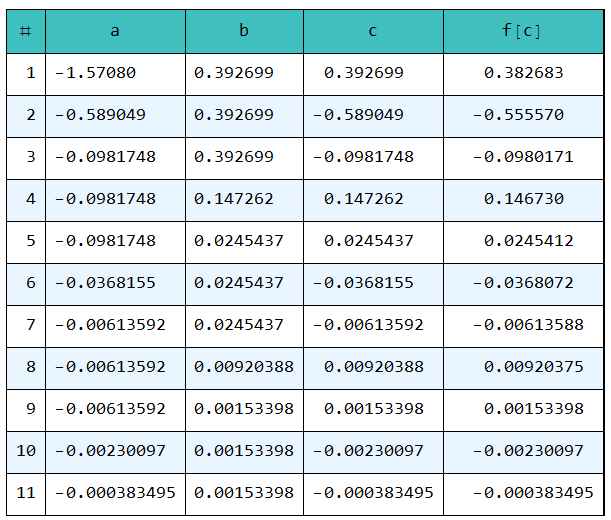
Table is the preferred form of usage in Mma and you can assign this table a name for later use. With the function as defined above,
(a = -Pi/2;
  b = 3 Pi/4;
  tolerance = 0.0000;
  t = Table[c = (a + b)/2; If[f[a]*f[c] < tolerance, b = c, a = c];
     {i, N[a, 4], N[b, 4], N[c, 4], N[f[c], 4]}, {i, 1, 11}]);

t // Grid[#, Alignment -> "."] &
EDIT: Added headings/formatting
Headings and row numbers are required for presentation. At the same time, the table of data should also remain accessible. I have added a prec variable so that you can change precision easily. There are better ways of writing it all but let's defer that for another day.
(Clear["Global`*"];
  f[x_] := Sin[x] && a <= x <= b;
  a = -Pi/2;
  b = 3 Pi/4;
  prec = 6;
  tolerance = 0.0000;
  t = Table[c = (a + b)/2; If[f[a]*f[c] < tolerance, b = c, a = c];
     {i, N[a, prec], N[b, prec], N[c, prec], N[f[c], prec]}, {i, 1,
     11}];
  PrependTo[t, #] & @ {"#", "a", "b", "c", "f[c]"};
  );
.. and now the improved presentation:
t // Grid[#, Alignment -> {".", Automatic,
     ({1, #} -> Center) & /@ Range[5]
     },
   Frame -> All,
   Spacings -> {1, 1.4},
   Background -> {None,
     {Blend[{Cyan, Gray}], {White, Lighter@LightBlue}}}
   ] &
If you still want just the data (without the first row and first column), then you can have it as s:
(s = t[[2 ;; -1, 2 ;; -1]]) // MatrixForm

