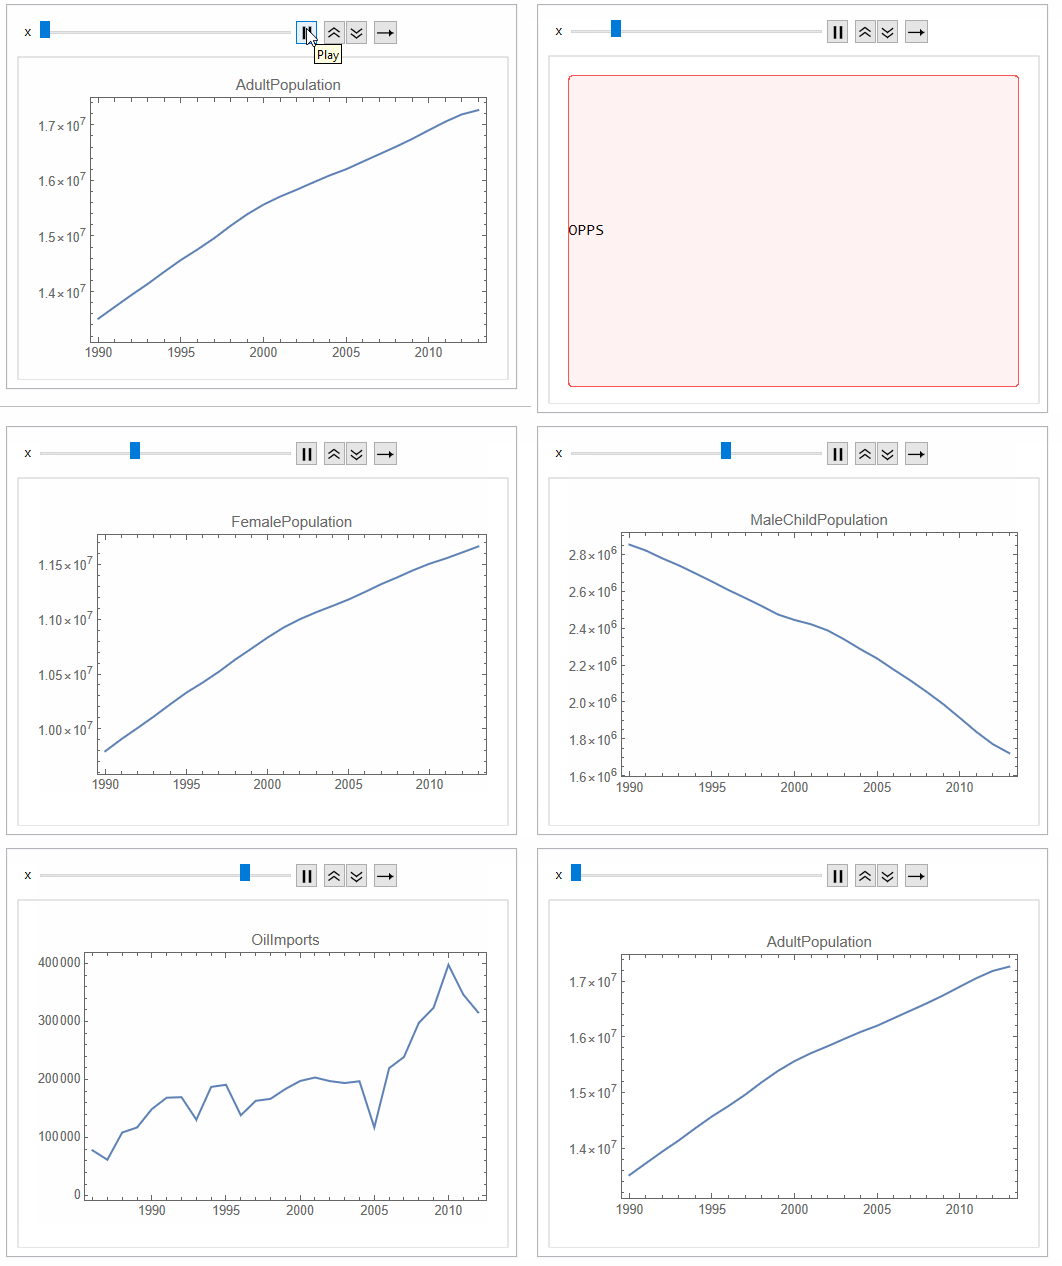
I tried to get a graph for water area in Taiwan, but somehow it doesn't seem to work:
CountryData[Entity["Country", "Taiwan"], "WaterArea"]
And now if I want to get the graph:
DateListPlot[
 CountryData["Taiwan", {{"WaterArea"}, {2015, 2021}}]]
It doesn't work.
Does anybody know if it is even possible to get this data from Wolfram in a graph?


CountryData. Your syntax is correct, which you can confirm by replacing "WaterArea" with "Population". $\endgroup$