0
$\begingroup$

I have a parametrical matrix (18x18) which I want to plot its eigenvalues with respect to a parameter. For simplicity, lets assume that it is instead a 3x3 matrix which is not fully numerical but depends on a parameter Y. So that all eigenvalues depend on Y as well. I need to plot all eigenvalues with respect to Y in a single plot (Y in the x-axis). Any suggestions?

In addition, would you please explain if I use Eigenvectors[A] to get eigenvectors (depending on Y), are the result normalized or I need to normalize them myself?

Thank you in advance.

$\endgroup$
3
  • 1
    $\begingroup$ Symbolic eigenvectors will not be normalized. $\endgroup$ Commented Dec 15, 2020 at 23:40
  • $\begingroup$ What do you want to plot when some of the eigenvalues are complex? Or is your matrix structured so that they are all real-valued? $\endgroup$
    – bill s
    Commented Dec 15, 2020 at 23:46
  • $\begingroup$ @bills at the end they are all real-valued. $\endgroup$
    – sara sam
    Commented Dec 16, 2020 at 1:15

1 Answer 1

3
$\begingroup$
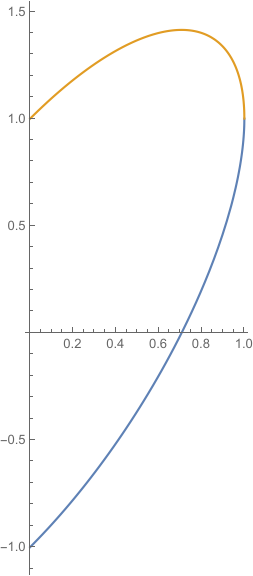
a = {{x, 1 + x}, {1 - x, x}};
eigenvalues = Eigenvalues[a]
Plot[eigenvalues, {x, 0, 1}]

{x - Sqrt[1 - x^2], x + Sqrt[1 - x^2]}

enter image description here

$\endgroup$

Your Answer

By clicking “Post Your Answer”, you agree to our terms of service and acknowledge you have read our privacy policy.

Not the answer you're looking for? Browse other questions tagged or ask your own question.