I have a finite chain (say $N$) which can be represented by a matrix(for e.g. a chain of $l$ atoms per unit cell, then it will be $(l\times N)$ $\times$ $(l\times N)$, this matrix depends on some parametrs. Now, my job is to find the eigenvalues and eigenvectors of these matrix, which is pretty simple job. However, now my system is finite so it has beginning and end (beginning and end of the chain of size $N$) . So, my job is to find them but in a special way.
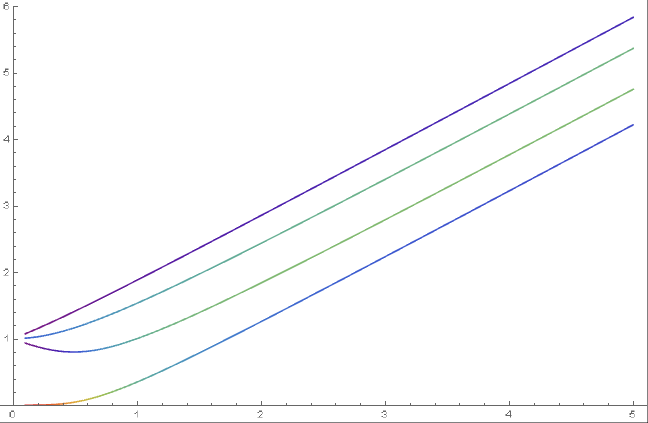
What I need to plot is, plotting the eigenvalues with respect to these parameters. But the values corresponding to the boundaries(or which lives on the ends) of the finite system will be plotted with different color. How to achieve this?
What i think can work (an idea not original to me)
I take the normalized eigenvectors($\psi$) and then calculate the position expectation($\psi^{*}_{m} m \psi_{m}$ and then use it for ColorData, which shows the different color for the end states and same for the states in the middle.
Is there a better a way? How it can be implemented?
Thanks a lot, I am stuck and not able to implement it in the Mathematica language(which I explained above)...
Example:
We have nearest hopping for $N =4$ and two atoms in unit cell(where, with in unit cell we have hopping $t1$ and outside $t2$). Chain is like, for e.g $1-2--3-4--5-6--7-8$(where $'-'$ : $t1$ and $'--'$ : $t2$)
Hamiltonian(in the basis of atomic positions) is:
H={{0,t1,0,0,0,0,0,0},{t1,0,t2,0,0,0,0,0},{0,t2,0,t1,0,0,0,0},...;
evg=Eigenvalues[H];
Ev=Eigenvectors[H];
Now evg has 8 eigenvalues and 8 eigenvectors. For some choice($t2>t1$ not equal 0) of $t1$, and $t2$ we have states near the edge. I want to plot the eigenvectors with respect say t2(from 0 to 2) by fixing t1(say 1). Then the color for states at the edges is different from the states not at the edge.


t2fort1 == 1according to the position expectation values? $\endgroup$